


Key statistics
As of last trade Inchcape PLC (INCH:LSE) traded at 786.00, -11.93% below its 52-week high of 892.50, set on Jul 27, 2023.
52-week range
Short selling activityProvided by S&P Global Market Intelligence
| Open | 750.00 |
|---|---|
| High | 795.50 |
| Low | 750.00 |
| Bid | 784.00 |
| Offer | 786.50 |
| Previous close | 719.00 |
| Average volume | 1.28m |
|---|---|
| Shares outstanding | 413.01m |
| Free float | 365.73m |
| P/E (TTM) | 11.10 |
| Market cap | 2.97bn GBP |
| EPS (TTM) | 0.6476 GBP |
| Annual div (ADY) | 33.90 GBX |
|---|---|
| Annual div yield (ADY) | 4.71% |
| Div ex-date | Aug 03 2023 |
| Div pay-date | Sep 01 2023 |
| Next div ex-date | May 02 2024 |
| Next div pay-date | Jun 17 2024 |
Data delayed at least 20 minutes, as of Apr 25 2024 15:43 BST.
More ▼
Investors Chronicle View
The last IC recommendation on Inchcape PLC shares was Hold at 857.00 on 27 Jul 2023Read the full article
Board of Directors
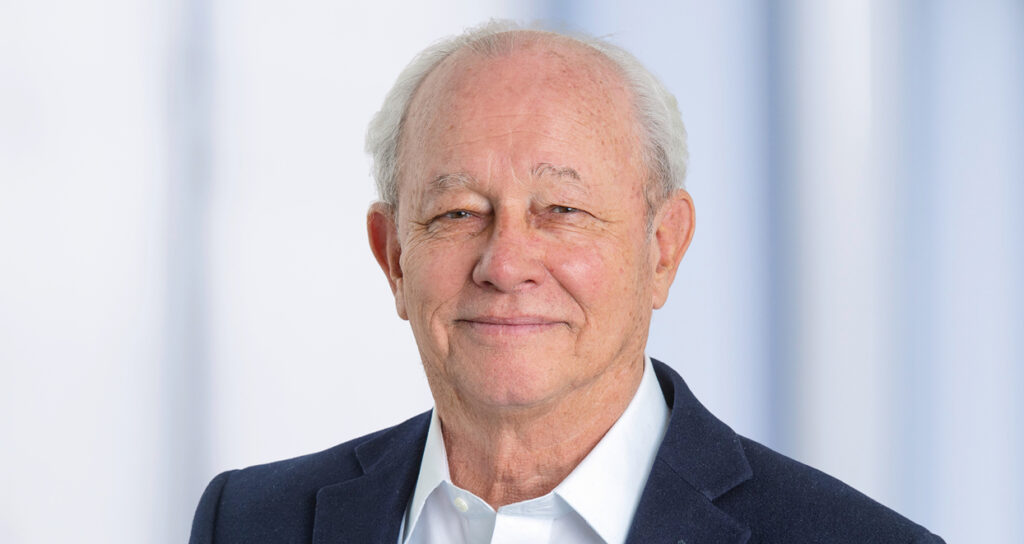
 1/12
1/12Nigel Stein, Chairman
 2/12
2/12Duncan Tait, Group Chief Executive
 3/12
3/12Adrian Lewis, Group Chief Financial Officer
 4/12
4/12Jerry Buhlmann, Senior Independent Director
 5/12
5/12Jane Kingston, Non-Executive Director
 6/12
6/12Sarah Kuijlaars, Non-Executive Director
 7/12
7/12Alex Jensen, Non-Executive Director
 8/12
8/12Nayantara Bali, Non-Executive Director
 9/12
9/12Juan Pablo Del Rio Goudie, Non-Executive Director
 10/12
10/12Byron Grote, Non-Executive Director
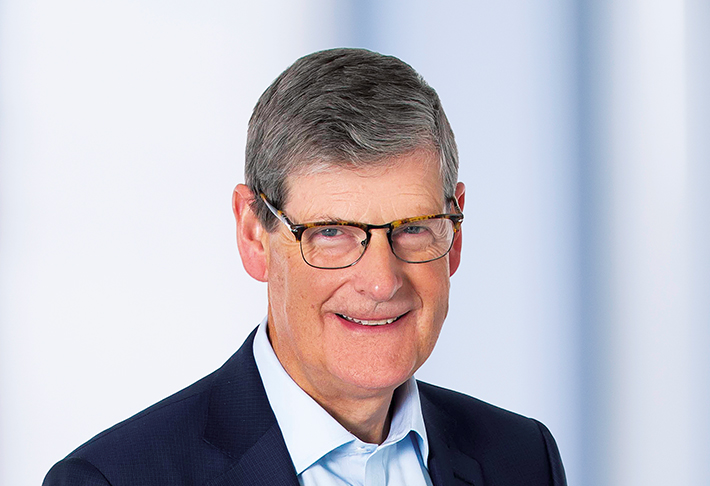
 11/12
11/12Stuart Rowley, Non-Executive Director
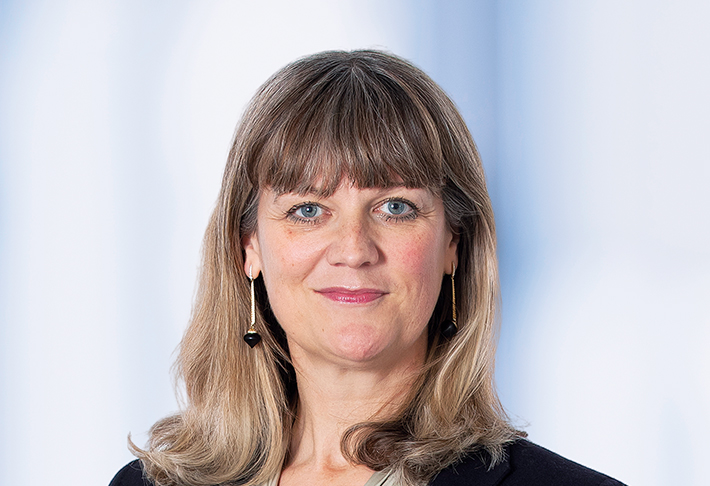
 12/12
12/12Alison Platt, Non-Executive Director

