PagerDuty Announces First Quarter Fiscal 2027 Financial Results
First quarter revenue increased 1% year over year to
Annual Recurring Revenue ("ARR") remained flat year over year at
First quarter operating income was
Net income was
Announced
This press release features multimedia. View the full release here: https://www.businesswire.com/news/home/20260528962339/en/
“Our Q1 results exceeded guidance for both revenue and non-GAAP operating margin, reflecting continued execution against our strategic and operational priorities,” said
Tejada continued, “John is off to a great start in leading
First Quarter Fiscal 2027 Financial Highlights
-
Revenue was
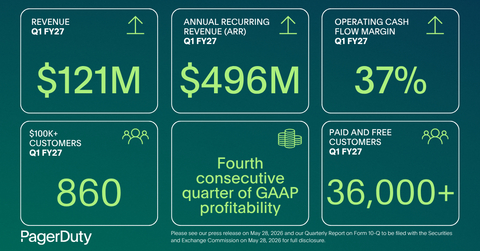
$121.0 million , an increase of 1.0% year over year. -
Operating income was
$9.2 million ; operating margin was 7.6%. -
Non-GAAP operating income was
$29.7 million ; non-GAAP operating margin was 24.6%. -
Net income was
$10.2 million , representing the Company's fourth consecutive quarter of GAAP profitability. -
Net income per diluted share attributable to
PagerDuty, Inc. common stockholders was$0.13 . -
Non-GAAP net income per diluted share attributable to
PagerDuty, Inc. common stockholders was$0.32 . -
Net cash provided by operating activities was
$44.3 million ; free cash flow was$41.2 million . -
Cash, cash equivalents, and investments were
$444.0 million as ofApril 30, 2026 .
The section titled “Non-GAAP Financial Measures” below contains a description of the non-GAAP financial measures and reconciliations between GAAP and non-GAAP financial information.
First Quarter and Recent Highlights
-
ARR as of
April 30, 2026 remained flat year over year at$496 million . -
Customers with ARR over
$100 thousand grew 1% to 860 as ofApril 30, 2026 , compared to 848 as ofApril 30, 2025 . -
Dollar-based net retention rate was 97% as of
April 30, 2026 , compared to 104% as ofApril 30, 2025 . -
Total paid customers were 15,380 as of
April 30, 2026 , compared to 15,247 as ofApril 30, 2025 . -
Paid and free customers totaled more than 36,000 as of
April 30, 2026 , representing approximately 14% growth sinceApril 30, 2025 . -
Remaining performance obligations were
$441 million as ofApril 30, 2026 . Of this amount, the Company expects to recognize revenue of approximately$316 million , or 72%, over the next 12 months,$100 million , or 23%, over months 13 to 24, and the remainder thereafter. -
Lands and expands include:
The Boston Consulting Group , Coreweave, Inc., The Gap, Inc., General Motors Company, LightSpun, Palo Alto Networks, Inc., and Vodafone Group Public Limited Company. -
Appointed
John DiLullo as Chief Executive Officer and announced Jennifer Tejada’s transition to Executive Chair of Board of Directors after serving as CEO since 2016. -
Announced the expansion of PagerDuty’s AI integration ecosystem, with strategic partnerships with
Anthropic , Cursor, and LangChain. - Announced enhancements to the PagerDuty Advance SRE Agent. Features new automated triage capabilities triggered directly from a team’s automated workflows to accelerate incident response.
- Named a Leader and Outperformer in 2026 Gigaom Radar for IT Incident Response Platforms for Fourth Consecutive Year.
- Published the 2026 State of AI-First Operations Report, which illustrates how the financial state of extended service disruption has made operational resilience a top priority.
-
Approved for the 2026 Trust Radius - Trusted Seller verification marking
PagerDuty as one of the elite companies on TrustRadius. - Named a finalist for the Best Technology for Good Initiative Category in the 2026 Halo Awards.
- Received silver in the 2026 American Business Awards for Corporate Social Responsibility Program of the Year.
-
Recognized as a finalist for six Inspiring Workplaces in 2026:
Latin America ,Europe ,UK &Ireland ,North America ,Australia &New Zealand , andAsia . - Announced PagerDuty’s latest Impact cohort including grants to eight nonprofits focused on healthcare, humanitarian and crisis-response.
Financial Outlook
For the second quarter of fiscal 2027,
-
Total revenue of
$122.0 million -$124.0 million . -
Non-GAAP net income per diluted share attributable to
PagerDuty, Inc. common stockholders of$0.29 -$0.31 assuming approximately 78 million diluted shares and a non-GAAP tax rate of 20%.
For the full fiscal year 2027,
-
Total revenue of
$488.5 million -$496.5 million , consistent with previous guidance. -
Non-GAAP net income per diluted share attributable to
PagerDuty, Inc. common stockholders of$1.27 -$1.32 (up from$1.23 -$1.28 ) assuming approximately 79 million diluted shares and a non-GAAP tax rate of 20%.
These statements are forward-looking and actual results may differ materially. Please refer to the section titled "Forward-Looking Statements" below for information on the factors that could cause our actual results to differ materially from these forward-looking statements.
Conference Call Information
Supplemental Financial and Other Information
Supplemental financial and other information can be accessed through PagerDuty’s investor relations website at investor.pagerduty.com.
Forward-Looking Statements
This press release and the related webcast contains “forward-looking statements” within the meaning of the “safe harbor” provisions of the Private Securities Litigation Reform Act of 1995, including but not limited to, statements regarding our future financial and operational performance and outlook, and strategies, objectives, opportunity, expectations and market positioning. Words such as “expect,” “extend,” “anticipate,” “should,” “believe,” “hope,” “target,” “project,” “accelerate,” “goals,” “estimate,” “potential,” “predict,” “may,” “will,” “might,” “could,” “intend,” “shall,” and variations of these terms or the negative of these terms and similar expressions are intended to identify these forward-looking statements. Forward-looking statements are subject to a number of risks and uncertainties, many of which involve factors or circumstances that are beyond our control. Our actual results could differ materially from those stated or implied in forward-looking statements due to a number of factors, including but not limited to, risks and other factors detailed in our Annual Report on Form 10-K filed with the Securities and Exchange Commission ("
Past performance is not necessarily indicative of future results. The forward-looking statements included in this press release and the related webcast represent our views as of the date of this press release and the related webcast. We anticipate that subsequent events and developments will cause our views to change. We undertake no intention or obligation to update or revise any forward-looking statements, whether as a result of new information, future events or otherwise. These forward-looking statements should not be relied upon as representing our views as of any date subsequent to the date of this press release and the related webcast.
About
The PagerDuty Operations Cloud
The PagerDuty Operations Cloud is an AI-powered platform that automates and orchestrates the entire incident management lifecycle - from detection to resolution, providing resilience at scale. Designed for mission-critical operations, the platform empowers teams to identify and diagnose disruptions in real time, mobilizing the right teams to quickly streamline workflows to solve digital issues before they become incidents. The PagerDuty Operations Cloud is essential for delivering flawless, always-on digital experiences that organizations and consumers expect today.
|
|
|||||||
|
|
Three months ended |
||||||
|
|
2026 |
|
2025 |
||||
|
Revenue |
$ |
120,967 |
|
|
$ |
119,805 |
|
|
Cost of revenue(1) |
|
19,020 |
|
|
|
19,184 |
|
|
Gross profit |
|
101,947 |
|
|
|
100,621 |
|
|
|
|
|
|
||||
|
Operating expenses: |
|
|
|
||||
|
Research and development(1) |
|
29,988 |
|
|
|
34,048 |
|
|
Sales and marketing(1) |
|
39,610 |
|
|
|
50,045 |
|
|
General and administrative(1) |
|
23,166 |
|
|
|
26,855 |
|
|
Total operating expenses |
|
92,764 |
|
|
|
110,948 |
|
|
Income (loss) from operations |
|
9,183 |
|
|
|
(10,327 |
) |
|
|
|
|
|
||||
|
Interest income |
|
3,926 |
|
|
|
6,011 |
|
|
Interest expense |
|
(2,107 |
) |
|
|
(2,364 |
) |
|
Other (expense) income, net |
|
(71 |
) |
|
|
114 |
|
|
Income (loss) before provision for income taxes |
|
10,931 |
|
|
|
(6,566 |
) |
|
Provision for income taxes |
|
5,801 |
|
|
|
813 |
|
|
Net income (loss) |
$ |
5,130 |
|
|
$ |
(7,379 |
) |
|
Net loss attributable to redeemable non-controlling interest |
|
(153 |
) |
|
|
(217 |
) |
|
Net income (loss) attributable to |
$ |
5,283 |
|
|
$ |
(7,162 |
) |
|
Less: Adjustment attributable to redeemable non-controlling interest |
|
(4,963 |
) |
|
|
(665 |
) |
|
Net income (loss) attributable to |
$ |
10,246 |
|
|
$ |
(6,497 |
) |
|
|
|
|
|
||||
|
Weighted-average shares used in calculating net income (loss) per share: |
|
|
|
||||
|
Basic |
|
78,647 |
|
|
|
91,374 |
|
|
Diluted |
|
79,464 |
|
|
|
91,374 |
|
|
Net income (loss) per share attributable to |
|
|
|
||||
|
Basic |
$ |
0.13 |
|
|
$ |
(0.07 |
) |
|
Diluted |
$ |
0.13 |
|
|
$ |
(0.07 |
) |
|
(1) Includes stock-based compensation expense as follows: |
|||||
|
|
Three months ended |
||||
|
|
2026 |
|
2025 |
||
|
Cost of revenue |
$ |
849 |
|
$ |
1,097 |
|
Research and development |
|
6,137 |
|
|
9,840 |
|
Sales and marketing |
|
4,184 |
|
|
6,219 |
|
General and administrative |
|
6,793 |
|
|
8,597 |
|
Total |
$ |
17,963 |
|
$ |
25,753 |
|
|
|||||||
|
|
|
|
|
||||
|
Assets |
|
|
|
||||
|
Current assets: |
|
|
|
||||
|
Cash and cash equivalents |
$ |
208,880 |
|
|
$ |
237,402 |
|
|
Investments |
|
235,077 |
|
|
|
232,436 |
|
|
Accounts receivable, net of allowance for credit losses of |
|
76,025 |
|
|
|
108,430 |
|
|
Deferred contract costs, current |
|
18,181 |
|
|
|
18,401 |
|
|
Prepaid expenses and other current assets |
|
20,867 |
|
|
|
15,570 |
|
|
Total current assets |
|
559,030 |
|
|
|
612,239 |
|
|
Property and equipment, net |
|
31,938 |
|
|
|
29,192 |
|
|
Deferred contract costs, non-current |
|
24,681 |
|
|
|
25,010 |
|
|
Lease right-of-use assets |
|
11,516 |
|
|
|
12,509 |
|
|
|
|
137,401 |
|
|
|
137,401 |
|
|
Intangible assets, net |
|
14,705 |
|
|
|
15,645 |
|
|
Deferred tax assets |
|
153,657 |
|
|
|
153,657 |
|
|
Other assets |
|
3,664 |
|
|
|
4,862 |
|
|
Total assets |
$ |
936,592 |
|
|
$ |
990,515 |
|
|
|
|
|
|
||||
|
Liabilities, redeemable non-controlling interest, and stockholders’ equity |
|
|
|
||||
|
Current liabilities: |
|
|
|
||||
|
Accounts payable |
$ |
4,438 |
|
|
$ |
6,718 |
|
|
Accrued expenses and other current liabilities |
|
15,240 |
|
|
|
19,868 |
|
|
Accrued compensation |
|
21,465 |
|
|
|
25,856 |
|
|
Deferred revenue, current |
|
240,620 |
|
|
|
246,451 |
|
|
Lease liabilities, current |
|
5,249 |
|
|
|
5,000 |
|
|
Total current liabilities |
|
287,012 |
|
|
|
303,893 |
|
|
Convertible senior notes, net, non-current |
|
396,327 |
|
|
|
395,729 |
|
|
Deferred revenue, non-current |
|
2,747 |
|
|
|
2,483 |
|
|
Lease liabilities, non-current |
|
11,174 |
|
|
|
12,598 |
|
|
Other liabilities |
|
10,845 |
|
|
|
5,147 |
|
|
Total liabilities |
|
708,105 |
|
|
|
719,850 |
|
|
|
|
|
|
||||
|
Redeemable non-controlling interest |
|
11,956 |
|
|
|
17,072 |
|
|
|
|
|
|
||||
|
Stockholders' equity |
|
|
|
||||
|
Common stock |
|
— |
|
|
|
— |
|
|
Additional paid-in capital |
|
633,760 |
|
|
|
679,410 |
|
|
Accumulated other comprehensive loss |
|
(715 |
) |
|
|
(183 |
) |
|
Accumulated deficit |
|
(416,514 |
) |
|
|
(421,797 |
) |
|
|
|
— |
|
|
|
(3,837 |
) |
|
Total stockholders’ equity |
|
216,531 |
|
|
|
253,593 |
|
|
Total liabilities, redeemable non-controlling interest, and stockholders' equity |
$ |
936,592 |
|
|
$ |
990,515 |
|
|
|
|||||||
|
|
Three months ended |
||||||
|
|
2026 |
|
2025 |
||||
|
Cash flows from operating activities: |
|
|
|
||||
|
Net income (loss) attributable to |
$ |
10,246 |
|
|
$ |
(6,497 |
) |
|
Net loss and adjustment attributable to redeemable non-controlling interest |
|
(5,116 |
) |
|
|
(882 |
) |
|
Net income (loss) |
|
5,130 |
|
|
|
(7,379 |
) |
|
Adjustments to reconcile net income (loss) to net cash provided by operating activities: |
|
|
|
||||
|
Depreciation and amortization |
|
3,056 |
|
|
|
3,962 |
|
|
Amortization of deferred contract costs |
|
5,201 |
|
|
|
5,514 |
|
|
Amortization of debt issuance costs |
|
595 |
|
|
|
677 |
|
|
Stock-based compensation |
|
17,963 |
|
|
|
25,753 |
|
|
Non-cash lease expense |
|
985 |
|
|
|
379 |
|
|
Deferred income taxes |
|
5,736 |
|
|
|
162 |
|
|
Other |
|
(595 |
) |
|
|
(811 |
) |
|
Changes in operating assets and liabilities: |
|
|
|
||||
|
Accounts receivable |
|
32,618 |
|
|
|
27,610 |
|
|
Deferred contract costs |
|
(4,693 |
) |
|
|
(4,579 |
) |
|
Prepaid expenses and other assets |
|
(5,045 |
) |
|
|
(3,316 |
) |
|
Accounts payable |
|
(2,825 |
) |
|
|
103 |
|
|
Accrued expenses and other liabilities |
|
(2,803 |
) |
|
|
(1,973 |
) |
|
Accrued compensation |
|
(4,493 |
) |
|
|
(8,336 |
) |
|
Deferred revenue |
|
(5,380 |
) |
|
|
(6,411 |
) |
|
Lease liabilities |
|
(1,167 |
) |
|
|
(685 |
) |
|
Net cash provided by operating activities |
|
44,283 |
|
|
|
30,670 |
|
|
Cash flows from investing activities: |
|
|
|
||||
|
Purchases of property and equipment |
|
(965 |
) |
|
|
(441 |
) |
|
Capitalized software costs |
|
(2,126 |
) |
|
|
(1,243 |
) |
|
Purchases of available-for-sale investments |
|
(40,296 |
) |
|
|
(44,148 |
) |
|
Proceeds from maturities of available-for-sale investments |
|
37,420 |
|
|
|
44,400 |
|
|
Purchases of non-marketable equity investments |
|
— |
|
|
|
(250 |
) |
|
Proceeds from liquidation of non-marketable equity investments |
|
894 |
|
|
|
— |
|
|
Net cash used in investing activities |
|
(5,073 |
) |
|
|
(1,682 |
) |
|
Cash flows from financing activities: |
|
|
|
||||
|
Repurchases of common stock |
|
(65,456 |
) |
|
|
— |
|
|
Proceeds from issuance of common stock upon exercise of stock options |
|
4 |
|
|
|
3,602 |
|
|
Employee payroll taxes paid related to net share settlement of restricted stock units |
|
(2,156 |
) |
|
|
(7,557 |
) |
|
Net cash used in financing activities |
|
(67,608 |
) |
|
|
(3,955 |
) |
|
Effects of foreign currency exchange rates on cash, cash equivalents, and restricted cash |
|
(124 |
) |
|
|
335 |
|
|
Net change in cash, cash equivalents, and restricted cash |
|
(28,522 |
) |
|
|
25,368 |
|
|
Cash, cash equivalents, and restricted cash at beginning of period |
|
238,481 |
|
|
|
348,328 |
|
|
Cash, cash equivalents, and restricted cash at end of period |
$ |
209,959 |
|
|
$ |
373,696 |
|
|
Note: Certain reclassifications of prior period amounts have been made in the Company’s condensed consolidated statements of cash flows to conform to the current period presentation. Refer to the notes to our Quarterly Report on Form 10-Q for more information. |
Non-GAAP Financial Measures
This press release and the accompanying tables contain the following non-GAAP financial measures: non-GAAP gross profit, non-GAAP gross margin, non-GAAP research and development, non-GAAP sales and marketing, non-GAAP general and administrative, non-GAAP operating income, non-GAAP operating margin, non-GAAP net income attributable to
The principal limitation of these non-GAAP financial measures is that they exclude significant expenses and income that are required by GAAP to be recorded in PagerDuty’s financial statements. In addition, they are subject to inherent limitations as they reflect the exercise of judgment by PagerDuty’s management about which expenses and income are excluded or included in determining these non-GAAP financial measures. A reconciliation is provided below for each historical non-GAAP financial measure to the most directly comparable financial measure presented in accordance with GAAP.
Specifically,
Stock-based compensation:
Employer taxes related to employee stock transactions:
Amortization of acquired intangible assets:
Acquisition-related expenses:
Amortization of debt issuance costs: The imputed interest rates of the Company's convertible senior notes (the "2025 Notes" and the "2028 Notes" or, collectively, the "Notes") was approximately 1.91% for the 2025 Notes and 2.13% for the 2028 Notes. This is a result of the debt issuance costs, which reduce the carrying value of the convertible debt instruments. The debt issuance costs are amortized as interest expense. The expense for the amortization of the debt issuance costs is a non-cash item, and we believe the exclusion of this interest expense will provide for a more useful comparison of our operational performance in different periods.
Restructuring costs:
Shareholder matters:
Adjustment attributable to redeemable non-controlling interest:
Income tax effects and adjustments:Based on
Non-GAAP gross profit and non-GAAP gross margin
We define non-GAAP gross profit as gross profit excluding the following expenses typically included in cost of revenue: stock-based compensation expense, employer taxes related to employee stock transactions, amortization of acquired intangible assets, and restructuring costs. We define non-GAAP gross margin as non-GAAP gross profit as a percentage of revenue.
Non-GAAP operating expenses
We define non-GAAP operating expenses as operating expenses excluding stock-based compensation expense, employer taxes related to employee stock transactions, amortization of acquired intangible assets, acquisition-related expenses, restructuring costs, and shareholder matters, which are not necessarily reflective of operational performance during a given period.
Non-GAAP operating income and non-GAAP operating margin
We define non-GAAP operating income as income (loss) from operations excluding stock-based compensation expense, employer taxes related to employee stock transactions, amortization of acquired intangible assets, acquisition-related expenses, restructuring costs, and shareholder matters, which are not necessarily reflective of operational performance during a given period. We define non-GAAP operating margin as non-GAAP operating income as a percentage of revenue.
Non-GAAP net income attributable to
We define non-GAAP net income attributable to
Non-GAAP net income per share, basic and diluted
We define non-GAAP net income per share, basic as non-GAAP net income attributable to
Free cash flow and free cash flow margin
We define free cash flow as net cash provided by operating activities, less cash used for purchases of property and equipment and capitalization of software costs. We define free cash flow margin as free cash flow as a percentage of revenue. In addition to the reasons stated above, we believe that free cash flow is useful to investors as a liquidity measure because it measures our ability to generate or use cash in excess of our capital investments in property and equipment in order to enhance the strength of our balance sheet and further invest in our business and potential strategic initiatives. A limitation of the utility of free cash flow as a measure of our liquidity is that it does not represent the total increase or decrease in our cash balance for the period. We use free cash flow in conjunction with traditional
Please see the reconciliation tables at the end of this release for the reconciliation of non-GAAP financial measures to their most-comparable GAAP financial measures.
|
|
|||||||
|
|
Three months ended |
||||||
|
|
2026 |
|
2025 |
||||
|
Non-GAAP gross profit and non-GAAP gross margin |
|
|
|
||||
|
Gross profit |
$ |
101,947 |
|
|
$ |
100,621 |
|
|
Add: |
|
|
|
||||
|
Stock-based compensation |
|
849 |
|
|
|
1,097 |
|
|
Employer taxes related to employee stock transactions |
|
11 |
|
|
|
38 |
|
|
Amortization of acquired intangible assets |
|
320 |
|
|
|
1,273 |
|
|
Restructuring costs |
|
332 |
|
|
|
— |
|
|
Non-GAAP gross profit |
$ |
103,459 |
|
|
$ |
103,029 |
|
|
|
|
|
|
||||
|
Revenue |
$ |
120,967 |
|
|
$ |
119,805 |
|
|
Gross margin |
|
84.3 |
% |
|
|
84.0 |
% |
|
Non-GAAP gross margin |
|
85.5 |
% |
|
|
86.0 |
% |
|
|
|
|
|
||||
|
Non-GAAP operating expenses |
|
|
|
||||
|
Research and development |
$ |
29,988 |
|
|
$ |
34,048 |
|
|
Less: |
|
|
|
||||
|
Stock-based compensation |
|
6,137 |
|
|
|
9,840 |
|
|
Employer taxes related to employee stock transactions |
|
105 |
|
|
|
304 |
|
|
Acquisition-related expenses |
|
— |
|
|
|
228 |
|
|
Restructuring costs |
|
— |
|
|
|
1,373 |
|
|
Non-GAAP research and development |
$ |
23,746 |
|
|
$ |
22,303 |
|
|
|
|
|
|
||||
|
Sales and marketing |
$ |
39,610 |
|
|
$ |
50,045 |
|
|
Less: |
|
|
|
||||
|
Stock-based compensation |
|
4,184 |
|
|
|
6,219 |
|
|
Employer taxes related to employee stock transactions |
|
49 |
|
|
|
182 |
|
|
Amortization of acquired intangible assets |
|
620 |
|
|
|
633 |
|
|
Restructuring costs |
|
1,099 |
|
|
|
2,210 |
|
|
Non-GAAP sales and marketing |
$ |
33,658 |
|
|
$ |
40,801 |
|
|
|
|
|
|
||||
|
General and administrative |
$ |
23,166 |
|
|
$ |
26,855 |
|
|
Less: |
|
|
|
||||
|
Stock-based compensation |
|
6,793 |
|
|
|
8,597 |
|
|
Employer taxes related to employee stock transactions |
|
61 |
|
|
|
194 |
|
|
Restructuring costs |
|
— |
|
|
|
228 |
|
|
Shareholder matters |
|
— |
|
|
|
2,270 |
|
|
Non-GAAP general and administrative |
$ |
16,312 |
|
|
$ |
15,566 |
|
|
Note: Certain figures may not sum due to rounding. |
|
|
|||||||
|
|
Three months ended |
||||||
|
|
2026 |
|
2025 |
||||
|
Non-GAAP operating income and non-GAAP operating margin |
|
|
|
||||
|
Income (loss) from operations |
$ |
9,183 |
|
|
$ |
(10,327 |
) |
|
Add: |
|
|
|
||||
|
Stock-based compensation |
|
17,963 |
|
|
|
25,753 |
|
|
Employer taxes related to employee stock transactions |
|
226 |
|
|
|
718 |
|
|
Amortization of acquired intangible assets |
|
940 |
|
|
|
1,906 |
|
|
Acquisition-related expenses |
|
— |
|
|
|
228 |
|
|
Restructuring costs |
|
1,431 |
|
|
|
3,811 |
|
|
Shareholder matters |
|
— |
|
|
|
2,270 |
|
|
Non-GAAP operating income |
$ |
29,743 |
|
|
$ |
24,359 |
|
|
|
|
|
|
||||
|
Revenue |
$ |
120,967 |
|
|
$ |
119,805 |
|
|
Operating margin |
|
7.6 |
% |
|
|
(8.6 |
)% |
|
Non-GAAP operating margin |
|
24.6 |
% |
|
|
20.3 |
% |
|
|
|
|
|
||||
|
Non-GAAP net income attributable to |
|
|
|
||||
|
Net income (loss) attributable to |
$ |
10,246 |
|
|
$ |
(6,497 |
) |
|
Add: |
|
|
|
||||
|
Stock-based compensation |
|
17,963 |
|
|
|
25,753 |
|
|
Employer taxes related to employee stock transactions |
|
226 |
|
|
|
718 |
|
|
Amortization of debt issuance costs |
|
595 |
|
|
|
677 |
|
|
Amortization of acquired intangible assets |
|
940 |
|
|
|
1,906 |
|
|
Acquisition-related expenses |
|
— |
|
|
|
228 |
|
|
Restructuring costs |
|
1,431 |
|
|
|
3,811 |
|
|
Shareholder matters |
|
— |
|
|
|
2,270 |
|
|
Adjustment attributable to redeemable non-controlling interest |
|
(4,963 |
) |
|
|
(665 |
) |
|
Income tax effects and adjustments |
|
(616 |
) |
|
|
(5,522 |
) |
|
Non-GAAP net income attributable to |
$ |
25,822 |
|
|
$ |
22,679 |
|
|
|
|
|
|
||||
|
Non-GAAP net income per share, basic |
|
|
|
||||
|
Net income (loss) per share attributable to |
$ |
0.13 |
|
|
$ |
(0.07 |
) |
|
Non-GAAP adjustments to net income (loss) per share attributable to |
|
0.20 |
|
|
|
0.32 |
|
|
Non-GAAP net income per share attributable to |
$ |
0.33 |
|
|
$ |
0.25 |
|
|
|
|
|
|
||||
|
Non-GAAP net income per share, diluted |
|
|
|
||||
|
Net income (loss) per share attributable to |
$ |
0.13 |
|
|
$ |
(0.07 |
) |
|
Non-GAAP adjustments to net income (loss) per share attributable to |
|
0.20 |
|
|
|
0.31 |
|
|
Non-GAAP net income per share attributable to |
$ |
0.32 |
|
|
$ |
0.24 |
|
|
|
|
|
|
||||
|
Weighted-average shares used in calculating net income per share |
|
|
|
||||
|
Basic |
|
78,647 |
|
|
|
91,374 |
|
|
Diluted |
|
79,464 |
|
|
|
91,374 |
|
|
|
|
|
|
||||
|
Weighted-average shares used in calculating non-GAAP net income per share |
|
|
|
||||
|
Basic |
|
78,647 |
|
|
|
91,374 |
|
|
Diluted |
|
79,464 |
|
|
|
93,656 |
|
|
Note: Certain figures may not sum due to rounding. |
|
|
|||||||
|
|
Three months ended |
||||||
|
|
2026 |
|
2025 |
||||
|
Free cash flow and free cash flow margin |
|
|
|
||||
|
Net cash provided by operating activities |
$ |
44,283 |
|
|
$ |
30,670 |
|
|
Purchases of property and equipment |
|
(965 |
) |
|
|
(441 |
) |
|
Capitalization of software costs |
|
(2,126 |
) |
|
|
(1,243 |
) |
|
Free cash flow |
$ |
41,192 |
|
|
$ |
28,986 |
|
|
Net cash used in investing activities |
$ |
(5,073 |
) |
|
$ |
(1,682 |
) |
|
Net cash used in financing activities |
$ |
(67,608 |
) |
|
$ |
(3,955 |
) |
|
|
|
|
|
||||
|
Revenue |
$ |
120,967 |
|
|
$ |
119,805 |
|
|
Operating cash flow margin |
|
36.6 |
% |
|
|
25.6 |
% |
|
Free cash flow margin |
|
34.1 |
% |
|
|
24.2 |
% |
View source version on businesswire.com: https://www.businesswire.com/news/home/20260528962339/en/
Investor Relations Contact:
investor@pagerduty.com
Media Contact:
media@pagerduty.com
SOURCE
Source:
