Annual Results for the year ended 30 June 2025
Source: RNS
1 October 2025
Litigation Capital Management Limited
("LCM" or the "Company")
Full year audited results for the year ended 30 June 2025
Highlights
|
• |
Net realised gains of A$22.2m (FY24: A$23.0m), with concluded case investments generating a 1.8x multiple of invested capital (MOIC) |
|
• |
Total loss of A$82.0m (FY24: Total income of A$44.7m) following a number of trial losses, several of which are under appeal |
|
• |
Loss after tax for the period of A$72.9m (FY24: Profit after tax of A$12.7m) |
|
• |
Net assets of A$114.4m (FY24: A$188.9m) |
|
• |
Total new commitments of A$79m added in the period (FY24: A$279m) |
Strategic Update
|
• |
Strategic review commenced |
|
• |
Strategic options to be benchmarked against lean run-off operating model |
Commenting on the results, Patrick Moloney, CEO of Litigation Capital Management, said: "The last 12 months have been the most challenging in LCM's history as we experienced a series of adverse case outcomes impacting our financial performance. These setbacks, while disappointing, have underscored the inherent risks of our asset class and the lessons we have learned are shaping our path forward. Our team's resilience and decisive actions, including significant cost reductions and a refocused investment strategy, have laid a foundation for recovery. Looking ahead, we are committed to restoring LCM's track record of delivering value through a reinvigorated focus on active management of case investments, a cornerstone of our historical success."
Analyst and investor presentation
The Company will also be hosting a live presentation for all existing and potential shareholders via the Investor Meet Company at 14:00 BST today. If you would like to attend this presentation, please register using the following link:
https://www.investormeetcompany.com/litigation-capital-management-limited/register-investor
The presentation is open to all existing and potential shareholders. Investors who already follow LCM on the Investor Meet Company platform will automatically be invited.
Enquiries
|
Litigation Capital Management |
|
|
Patrick Moloney, Chief Executive Officer David Collins, Chief Financial Officer |
|
|
|
|
|
Cavendish (Nomad and Joint Broker) |
Tel: 020 7523 8000 |
|
Jonny Franklin-Adams and Isaac Hooper (Corporate Finance) Tim Redfern and Jamie Anderson (Corporate Broking)
|
|
|
|
|
|
|
|
NOTES TO EDITORS
Litigation Capital Management (LCM) is an alternative asset manager specialising in disputes financing solutions internationally, which operates two business models. The first is direct investments made from LCM's permanent balance sheet capital and the second is third party fund management. Under those two business models, LCM currently pursues three investment strategies: Single-case funding, Portfolio funding and Acquisitions of claims. LCM generates its income from both its direct investments and also performance fees through asset management.
LCM has an unparalleled track record driven by disciplined project selection and robust risk management. Currently headquartered in Sydney, with offices in London and Singapore, LCM listed on AIM in December 2018, trading under the ticker LIT.
CEO Report
This year has been the most challenging in LCM's history. Despite our established long-term track record of successful outcomes and consistent returns on invested capital, an unprecedented number of adverse case results have negatively impacted our performance over the past 12 months. We recorded 6 wins against 6 losses in FY25, with a further 3 cases losing at trial during the period and now being under appeal. Disappointingly, several of the adverse outcomes were for cases where we had invested significant shareholder capital. While these results are reflective of the inherent binary risk in our asset class, they have fallen well short of our expectations and historical benchmarks.
Post-year-end, we announced the termination of our investment in the Gladstone class action in Australia, which was initiated in 2018. In our view, the expert evidence was insufficient to support the case theory and we therefore took the difficult decision to terminate rather than incur significant further trial-related costs. The settlement includes payment of costs, fully covered by After-the-Event Insurance, and we are pursuing potential recoveries through a costs assessment and a negligence claim against the initial solicitors.
While these setbacks have tested our resilience, they have also provided valuable insights. We are committed to applying the lessons learned to strengthen our operations, refine our strategy, and reposition LCM for long-term recovery.
Lessons Learned
As LCM has grown, expanded internationally, and transitioned into a funds management business, my role as CEO has evolved to meet the demands of this transformation. Previously centred on managing legal investments through daily engagement with solicitors, barristers, and independent experts, my focus has shifted toward driving strategic expansion. This has involved working closely with investment bankers, financial intermediaries, and capital providers to position LCM for long-term success in the funds management space.
This strategic shift has been instrumental in enabling LCM's transition to a funds management model, where we have raised significant private capital to fuel growth. To support this evolution, we strengthened our team by recruiting highly skilled legal professionals from leading law firms and litigation funders to oversee day-to-day investment management. While their expertise has been invaluable, I recognise that our approach to investment management may not have fully sustained the proactive and tenacious rigor that defined LCM's earlier success.
In recent years, our investment management strategy may have, at times, aligned more closely with the industry's standard lawyer-led approach. Unlike many of our single-case peers, LCM's historical strength has been our hands-on, active investment management, which has driven superior outcomes. Reflecting on this, I see an opportunity to reinvigorate our unique approach to ensure we return to delivering attractive multiples on invested capital.
In my view, without genuinely active investment management, it is very difficult to deliver attractive returns in this asset class-despite it having appealing characteristics, such as being uncorrelated to broader economic cycles and offering the potential for significant returns when good investments are selected and managed appropriately.
LCM's historic success was built on our unique approach to active investment management, particularly due to our origins in the Australian market, where funders can contribute to case strategy. I am now entirely focussed on returning to the area where I believe I can add the most value: the hands-on rigour of active investment management.
I have already initiated actions on the existing portfolio to proactively realign it. I am doing so, working alongside two key colleagues with whom I have collaborated for over a decade and with whom I built our previously industry-leading track record.
This review of the portfolio and of recent losses has led to a number of conclusions and subsequent actions including:
· Decisive Action on Underperforming Investments: In good faith, we have attempted to salvage challenged investments by injecting additional resources such as enhancing legal teams. In hindsight, this has at times led to escalating commitments, especially in larger legacy positions, leading to suboptimal capital allocation. Going forward, we will emphasize rapid evaluations and timely exits where warranted to preserve capital.
· Managing Concentration Risk: This challenge is interconnected with delayed action on underperformers, allowing certain positions to become disproportionately large. We are dedicated to mitigating future risks through balanced investment sizing, fostering optimal risk-adjusted returns.
· Enhanced Scrutiny of Expert Evidence: A recurring factor in recent losses has been insufficient critical evaluation of expert reports, as case lawyers often lack the quantitative expertise to challenge them effectively. To counter this, we are instituting a more rigorous due diligence process, including engagement of independent quantitative specialists and integration of advanced analytical tools early in case assessments. This will ensure evidence is thoroughly vetted, minimizing the impact of flawed damages assumptions.
Strategic Review
In the second half of FY25, following our series of losses and the resulting higher leverage position, we intensified efforts to explore strategic options. We have proactively engaged with a diverse range of counterparties to assess potential transactions, including capital raises, strategic partnerships, and asset sales. These discussions have generated some promising leads.
To advance these opportunities in a structured manner, we appointed Luminis Partners as our independent financial advisor. The strategic review is now well progressed, with advanced discussions underway with a number of counterparties.
Furthermore, our dialogue with our lender has been constructive. Considering the recent adverse case results that LCM has experienced, we have been in discussions with the lender for a period of time. Based on these discussions, we understand that the lender's current intention is to continue to support LCM for the next 12 months as the management team completes the strategic review. The lender's intention is subject to ongoing review and may be reconsidered in light of future developments or changes in LCM's circumstances.
As well as considering external opportunities, we are also repositioning the business organically to put us on a sustainable footing. This encompasses a transition to a run-off model with a concentrated effort to manage our existing investments to realise value for shareholders. Consistent with this plan, we have taken significant action on our cost base, reducing our operating expenses by half, and with the scope for further meaningful reductions as we reposition our investment management approach.
Dubai
It was reported in May 2025 by one publication that Dubai prosecutors were formally probing London-listed Litigation Capital Management (LCM) of corruption offences, alongside its CEO Patrick Moloney. This included money laundering. It was subsequently reported by the same publication that Dubai prosecutors had formally accused London-listed Litigation Capital Management (LCM) of such corruption offences. LCM made it clear immediately it had never been contacted about such a case, and was not aware of any such investigation or formal allegations. Rumours of the probe had evidently been circulating in certain areas of the disputes sector by late 2024 the publication reported.
While LCM has been fully exonerated in this matter, the process has clearly negatively impacted the company, affecting multiple key business areas and restricting strategic opportunities that were advanced at the time including the anticipated first close of Fund III. In our view, it cannot be disputed that this was entirely avoidable if LCM had been approached at an early state of any investigation, rather than finding out about this process from a press leak. Such approach would have made it clear to the relevant UAE authorities that LCM had absolutely no case to answer as has now formally been confirmed, and the investigation was entirely ill conceived and potentially malicious. Due process was not followed and the financial impact has been significant.
We are actively reviewing our legal options to ensure the company can be compensated to the full extent possible.
In May, we addressed online press speculation regarding a potential investigation against the Company by a Dubai legal authority. We have since been notified that the investigation has concluded, with all allegations against LCM and myself fully dismissed. Furthermore, we understand that the dismissal includes a scathing verdict highlighting a complete lack of due process in the investigation, which led to the baseless allegations that were improperly leaked to the press.
The wholly unacceptable disclosure of this matter through media channels, rather than through official communication from the Dubai authorities, caused profound disruption to LCM's operations. This forced us to pause critical initiatives and pivot to alternative strategies. Notably, we were compelled to suspend fundraising for Fund III, which was on the cusp of a first close in early May. Additionally, preliminary discussions for a strategic review-later announced in September-were significantly delayed. This unwarranted postponement has materially undermined LCM's negotiating position and significantly hindered our ability to advance key strategic objectives.
Looking Forward
Through the actions we are taking, we are dedicated to restoring profitability and delivering value to shareholders. I extend my sincere appreciation to our dedicated team and loyal investors for their support during this trying time.
Chairman's Statement
Dear Shareholder,
In reviewing the past financial year I acknowledge the significant challenges LCM has encountered. FY25 has been the most difficult year in the company's history marked by an unprecedented number of case losses that have adversely affected our financial performance and cash flows. Despite these setbacks, our team has demonstrated resilience, taking decisive actions to stabilise the business amid near-term pressures from elevated debt levels. We remain committed to our long-term vision while prioritising financial stability.
To address these challenges we have right-sized operations, significantly reducing operating expenses through disciplined cost management. This included difficult decisions such as reducing headcount, carefully evaluating our overheads, and streamlining processes to enhance efficiency without compromising our core capabilities. New commitments were scaled back as we focused on high-quality opportunities and capital preservation, ensuring resources are allocated to deliver maximum value. Additionally, we conducted a thorough review of our fair value accounting, introduced two years ago, and adopted a more conservative approach in light of recent disappointing results.
The financial strain from case losses and reduced cash realisations increased our reliance on our debt facility. As a result, the Board has made the prudent decision to not pay a dividend, redirecting our focus to strengthening the balance sheet. These measures, though challenging, are critical to securing LCM's financial position and laying the groundwork for future stability. The binary nature of our investments means that in light of our increased indebtedness there is a risk that in certain circumstances, further case losses could lead to a breach of LCM's debt covenants. As a result, we are reporting a material uncertainty in relation to our going concern status (further detail on page 39). The management team have been proactively engaging with the lender over the last few months. The lender has indicated that its current intention, which is subject to ongoing review and may be reconsidered in light of future developments or change in LCM's circumstances, is to continue to support LCM for the next 12 months as we advance the strategic review announced on 15 September 2025.
Looking ahead we are now focused on completing the strategic review, evaluating all options to realise value for shareholders. These options will be benchmarked against a lean run-off model, which would involve further reductions in operating expenses and a shift to managing our existing portfolio of assets through to conclusion. Under this model, proceeds from successful case investments would be prioritised to reduce debt, with the long-term goal of delivering value for shareholders. We are committed to executing this review with rigour and transparency, keeping you informed as we shape the company's path forward.
This year also marked the departure of Gerhard Seebacher from the Board after over four years of service as a Non-Executive Director. Gerhard brought valuable expertise in financial services and fund management, contributing to our strategic discussions and governance. On behalf of the Board, I would like to thank Gerhard for his guidance during his tenure, and we wish him well in his future endeavours.
I am deeply grateful to our team for their unwavering commitment during this challenging period. I also extend my thanks to our shareholders for your continued support and trust, which are vital to our ongoing efforts.
We will keep you informed of our progress in the year ahead.
Jonathan Moulds
Non-Executive Chairman
Finance Review
|
Income Statement (A$'m) - LCM Only |
FY25 |
FY24 |
|
Concluded investments - Proceeds on LCM capital |
36.6 |
31.3 |
|
Concluded investments - Performance fees on 3P capital |
13.1 |
12.7 |
|
Concluded investments - LCM capital invested ("Cost") |
(27.5) |
(21.0) |
|
Net realised gains from concluded investments |
22.2 |
23.0 |
|
Litigation service revenue / (loss) |
(5.5) |
9.2 |
|
Fair value movement: |
|
|
|
Fair value removal for concluded investments |
(49.0) |
(33.0) |
|
Fair value write-down on case losses under appeal |
(44.5) |
- |
|
Net fair value movement on pre-hearing/trial ongoing investments and FX |
(6.6) |
45.4 |
|
Net fair value movement |
(100.1) |
12.5 |
|
Other income |
1.4 |
- |
|
Total income / (loss) |
(82.0) |
44.7 |
|
Operating expenses |
(18.0) |
(19.0) |
|
FX gains/losses |
5.7 |
0.5 |
|
Operating profit |
(94.4) |
26.3 |
|
Finance costs |
(7.3) |
(10.2) |
|
Profit before tax |
(101.7) |
16.1 |
|
Tax |
28.8 |
(3.3) |
|
Net income |
(72.9) |
12.7 |
|
|
|
|
|
Basic EPS (cents) |
(70.83) |
12.01 |
|
Diluted EPS (cents) |
(70.83) |
11.33 |
|
|
|
|
Investments that realised in the period generated a 1.8x multiple of invested capital (MOIC) for LCM. Those realisations included six wins and six losses, with the positive performance primarily driven by the arbitration win for funded party, Green-X Metals Limited, against the State of Poland, contributing A$26.1 million of net realised gains, and an arbitration claim against Tanzania contributing A$12.0 million of net realised gains. Those successful cases were offset by losses, the detail being set out in the table below.
Three cases with total LCM invested capital of A$45.1 million lost at trial and are either under appeal or seeking permission to appeal.
|
Realised Wins |
Invested capital |
Proceeds (incl perf fee) |
MOIC |
|
Australia Insolvency |
1.0 |
1.9 |
1.9 |
|
Treaty Arbitration |
1.5 |
13.5 |
9.0 |
|
US Insolvency |
0.2 |
0.3 |
1.5 |
|
Treaty Arbitration |
4.5 |
30.6 |
6.8 |
|
UK Litigation |
0.2 |
0.4 |
2.0 |
|
Australia Insolvency |
0.2 |
0.9 |
4.5 |
|
Total realised gains |
7.6 |
47.6 |
6.3 |
|
|
|
|
|
|
Realised Losses |
|
|
|
|
UK litigation |
6.7 |
0.0 |
0.0 |
|
UK Class Action |
1.0 |
0.0 |
0.0 |
|
US IP |
4.5 |
0.0 |
0.0 |
|
Competition |
1.9 |
0.0 |
0.0 |
|
Competition |
1.7 |
0.0 |
0.0 |
|
Commercial Arbitration |
2.6 |
0.0 |
0.0 |
|
Total realised Losses |
18.4 |
0.0 |
0.0 |
|
|
|
|
|
|
Partial Realisations |
1.7 |
2.2 |
|
|
|
|
|
|
|
Total |
27.5 |
49.7 |
1.8 |
|
|
|
|
|
|
Losses under appeal |
Invested capital |
Proceeds (incl perf fee) |
MOIC |
|
Aus class action |
26.1 |
0.9 |
0.0 |
|
Aus class action |
13.7 |
- |
0.0 |
|
UK commercial arbitration |
5.3 |
- |
0.0 |
|
Total Losses under appeal |
45.1 |
0.9 |
0.0 |
Note: Above figures are on an LCM only basis
The Litigation service revenue / (cost) line in the above P&L captures the results for the small number of cases that are held at contract cost under AASB 15 (as opposed to fair value accounting under AASB 9). One of the cases that is accounted for under AASB 15 lost at trial during the period and is being appealed. We are now taking the approach of holding such cases within a range of 50-60% of cost (see further detail below) as opposed to the prior approach of holding such losses under appeal at cost. That is the reason for the litigation service loss in the period (writedown of asset value to below cost). The prior period included a successful resolution of one of the cases held under AASB 15 which produced the positive revenue figure.
The net fair value movement in the period was negative at A$100.1m (FY24: positive A$12.5 million) and this is broken down into three components described below.
The first component is the fair value removal for investments that concluded in the period. As investments conclude we remove the fair value held against them (via this line) and replace that value with the actual result realised (in Net realised gains section of the P&L). Therefore, this line item will likely be negative each time we report, reflecting the removal of the fair value uplift on cases that concluded in the period.
Thus, all of the investments that realised in the period were held at a cumulative fair value of A$76.6 million (FY24: A$54.7 million) prior to realisation, being the cumulative fair value uplift of those investments (A$49.0 million; FY24 A$30.9 million) plus the capital invested into them (A$27.5 million; FY24 A$23.8 million). That fair value prior to realisation was equal to a multiple of cash invested of 2.8x.
The proportion of losses in the period being much higher than LCM's long-term average is a key reason why the realised MOIC (1.8x) on concluded cases is lower than their fair value MOIC prior to realisation (2.8x).
The second component of the fair value movement relates to two cases that lost at trial during the period and are being appealed. Our previous approach to accounting for cases that lost and are under appeal was to hold such investments at cost until the outcome of the appeal. In light of the series of losses that LCM has experienced in the last 12 months we have adopted a more conservative approach to valuing cases under appeal. Going forward, we will hold such cases at a value of between 50% and 60% of cost until the outcome of the appeal. This reflects that while the investment that was made to finance the first trial is still recoverable in the event of a successful appeal, the value of that asset today should be impaired to reflect the negative setback associated with the trial loss.
The total writedown on the two cases that lost and are under appeal was A$44.5 million, comprising A$29.0 million to remove the fair value uplift on those cases prior to appeal and a further A$15.6 million to move their valuations below cost to within the 50-60% of cost range.
The third component of the fair value movement, being the remaining fair value movements on ongoing case investments was a loss in the period of A$6.6 million (FY24: a gain of A$43.3 million). This loss has emerged as a result of a review of the fair value model that has been conducted in light of the recent disappointing case results. Two years after fair value accounting was first introduced and after the recent run of adverse case outcomes, the Board deemed it prudent for the Chief Financial Officer to reassess the fair value model, incorporating recent experience and his insights gained after more than 12 months in the role.
The review of the fair value assumptions highlighted a number of areas requiring enhancement. Expected profit assumptions have been lowered for a number of group claims (such as class actions) reflecting recent industry experience; duration assumptions have been modestly lengthened also reflecting recent experience; and the risk adjustment factors within the model have been adjusted to slow the rate of fair value recognition as a case passes through the different stages of proceedings as we aim to ensure that incremental fair value is only recognised when there has been clear and demonstrable evidence of meaningful case progress.
The changes that have been made to the fair value assumptions result in lower fair values at the end of the period and what will be a more conservative rate of fair value recognition going forward. After these assumption changes, ongoing cases (excluding the three cases that are accounted for at historical cost) are valued at 1.3x cash invested at the end of the period.
It is important to note that valuing LCM's investments is a subjective and difficult exercise due to the binary nature of the investments and we expect that enhancements to the fair value model will be a continuous process as LCM and the wider industry gains more case experience. The binary outcome nature of LCM's single case investments means that actual realised outcomes can differ significantly to the fair value those investments are held at prior to conclusion.
The above factors have led LCM to report a total loss in the period of A$82.0 million (FY24: A$44.7 million total income).
Operating expenses declined to A$18.0 million from A$19.0 million in the prior period. Management started taking action to reduce the cost base in the latter part of the second half and following further actions taken post period end we have significantly reduced the cost base to an annual rate of around half the equivalent rate from 12 months ago and this reduction will come through visibly in FY26.
Foreign exchange gains of A$5.7 million (FY24: gain of A$0.5 million) arose primarily as a result of the weakening of the USD in the second half with approximately half of LCM's outstanding debt denominated in USD.
This all resulted in an operating loss for the year of A$94.4 million (FY24: operating profit of A$26.3 million). After debt interest costs of A$7.3 million, which were down on the prior year (A$10.2 million) primarily due to the lower interest rate on the debt facility that was negotiated with the facility's extension in December of 2024, we are reporting a loss before tax of A$101.7 million (FY24: A$16.1 million). After tax this loss reduces to A$72.9 million (FY24: profit after tax of A$12.7 million). In light of this result, the Board has cancelled the dividend (FY24: 1.25p).
|
Balance Sheet (A$'m) - LCM Only |
FY25 |
FY24 |
|
Cash |
8.9 |
53.0 |
|
Debtors |
30.6 |
15.0 |
|
Investments at fair value |
124.8 |
202.9 |
|
Investments held at cost |
48.0 |
42.1 |
|
Other assets |
1.7 |
1.5 |
|
Total assets |
214.0 |
314.4 |
|
Borrowings |
(77.7) |
(61.9) |
|
Tax payable |
(0.0) |
(0.9) |
|
Deferred tax liability |
(15.3) |
(43.6) |
|
Other creditors |
(6.6) |
(20.0) |
|
Total liabilities |
(99.6) |
(125.5) |
|
Net assets |
114.4 |
188.9 |
|
|
|
|
|
NAV per share (pence) - Basic |
53.2 |
94.4 |
|
NAV per share (pence) - Diluted |
50.3 |
89.0 |
|
|
|
|
As of 30 June 2025, LCM was actively invested in 53 ongoing cases (FY24: 58) with a total balance sheet value of A$172.8 million (FY24: A$245.0 million). This valuation includes A$48.0 million related to three investments (FY24: A$42.1 million) that are accounted for under AASB 15 for historic accounting reasons, and A$124.8 million (FY24: A$202.9 million) for 50 investments (FY24: 55) that are held at fair value (AASB 9).
As previously noted, at the period end our case investments are held at an aggregate value of 1.3x the cumulative LCM cash invested into those cases (FY24: 2.4x) excluding the three cases accounted under AASB 15.
Cash at the period end was A$8.9 million, down significantly on the prior year (FY24: A$53.0 million) due to the ongoing cash outflows associated with case funding, operating expenses and interest payments not being offset by meaningful cash realisations as a result of the disproportionate number of losses in the period. When offset against borrowings of A$77.7 million (FY24: A$61.9 million) the net debt position at the end of the period increased to A$68.9 million (FY24: A$8.9 million).
Debtors have increased in the period, primarily attributable to the Green-X Metals case against Poland, which has been booked as a realised investment despite ongoing set-aside proceedings, as we view the likelihood of both awards (Green-X has secured both an Energy Charter Treaty award and a Australia-Poland Bilateral Investment Treaty award) being set aside as being very low. This view is supported by historical statistics that show set-aside proceedings typically succeed only in the single digit percentages of cases. As Poland has to win two set-aside proceedings to avoid payment that would imply a probability of the award being overturned via the set-aside proceedings of less than 1%. Furthermore, Donald Tusk, the prime minister of Poland, made a public statement in October 2024 following the awards saying that he believed that Poland will ultimately have to pay Green-X Metals Ltd as a consequence of the lost arbitration. So, as we believe the main risk from here is enforcement / collection risk rather than litigation risk, this asset is now recorded as a debtor rather than an investment at fair value.
From the prior period, all but A$1.8 million of the debtor balances at the end of FY24 (A$15.0 million) were collected in FY25.
Beyond borrowings, deferred tax of A$15.3 million is the next largest liability on the balance sheet. A$4.0 million of this relates to deferred tax on the fair value of our investments, with the balance due to historic case funding on ongoing cases that has already been recognised as an expense within our tax accounting.
As a result of the large loss in the period, net assets declined to A$114.4 million (FY24: A$188.9 million). Net assets per share at the end of the period was 50.3 pence on a fully diluted basis (FY24: 89.0 pence).
|
Cash Flow Statement (A$'m) - LCM Only |
FY25 |
FY24 |
|
Opening cash balance |
53.0 |
83.0 |
|
Cash generated from concluded investments |
33.6 |
56.7 |
|
Cash invested into ongoing cases (case funding) |
(59.8) |
(39.7) |
|
Operating expenses |
(16.0) |
(17.0) |
|
Net finance costs paid |
(6.5) |
(9.0) |
|
Dividend and share buyback |
(8.0) |
(10.4) |
|
Debt drawdown/repayments |
12.2 |
(8.1) |
|
Other |
0.4 |
(2.5) |
|
Closing cash balance |
8.9 |
53.0 |
|
|
|
|
|
Net debt |
68.9 |
8.9 |
|
|
|
|
During the period, cash generated from concluded investments in the period amounted to A$33.6 million (FY24: A$56.7 million), inclusive of A$6.4 million in performance fees (FY24: A$12.7 million). This included A$13.2m of debtors from the prior period end that were collected in the period.
The cash invested in case funding in the period totalled A$59.8m million (FY24: A$39.7 million), spread across 69 investments, of which 53 remained ongoing at the period end.
Operating expenses were lower than the prior period at A$16.0 million (FY24: A$17.0 million). The difference between this figure and the amount shown in the P&L primarily relates to share based payments, and reimbursements of operating expenses (in relation to fund management) which are disclosed as other income in the P&L.
Net finance costs paid declined to A$6.5 million (FY24: A$9.0 million) driven by the lower interest rate on the new debt facility. The difference between this figure and the amount shown in the P&L is interest accrued.
Tax paid was A$0.6 million (FY23: A$2.8 million) relating to UK tax paid on successful case conclusions in the prior financial year.
As a result of the lower cash coming into the business from successful case resolutions we drew down A$12.2 million from the debt facility (FY24: A$8.1 million repayment) to meet case funding, operating expenses and interest payments.
At the end of the financial period, we held A$8.9 million in cash (FY24: A$53.0 million) and had a net debt position of A$68.9 million (FY23: A$8.9 million).
New Commitments section
New commitments declined during the period to A$79.2 million (FY24: A$279.0 million), as our focus shifted to reducing balance sheet strain following the increase in leverage during the period.
Committed and Invested Capital
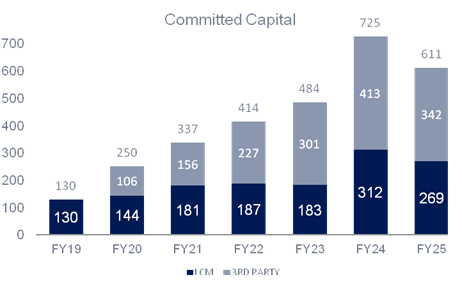
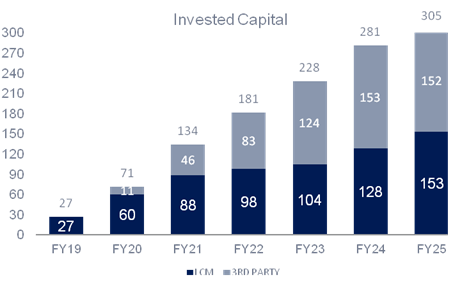
As of the end of the period, LCM was actively invested in 53 ongoing case investments. Among these, 11 were fully funded by our balance sheet (of which 3 cases comprise the majority of that invested capital) while 42 were co-funded through our asset management model, where LCM typically funds 25% of the investment cost.
Committed capital, which represents LCM share of total commitments across all active cases net of conclusions and terminations decreased to A$269.3 million at the period end (FY24: A$311.9 million). Of this amount, A$157.5 million gross has been deployed to date.
Asset Management
Since 2020, we have been transitioning our business model to that of an asset manager with cases funded typically 25% from our own balance sheet and 75% from third party funds. To date we have raised USD441 million in external funds across two funds: Fund I (USD150 million) and Fund II (USD291 million).
Fund I has invested in 23 case investments (net of 3 terminations) and was fully committed and 85% deployed at the end of the period. Twelve of these investments (9 wins and 3 losses) have fully concluded generating gross proceeds of US$121.3 million on LP invested capital of US$54.9 million. After accounting for performance fees of US$28.9 million paid to LCM, LP investors have achieved a 1.7 Net MOIC and a net IRR of 30.4% on realisations to date.
Fund II has invested into 37 cases (net of 13 terminations) and recently closed to new investments. The fund closed to new business at around 65% committed and was approaching US$50 million deployed as at 30 June 2025. Five investments have concluded to date (2 wins and 3 losses) generating an aggregate MOIC of 0.2x.
Post Period End
On 15 September 2025 we announced that LCM had terminated its investment in the Australian class action against Gladstone Ports Corporation in relation to alleged losses suffered by commercial fishermen from the large scale contamination of Gladstone harbour and surrounding waters from a toxic dredge spill in 2011-12. The investment was held on LCM's balance sheet at an amount of A$30.8 million, being equal to the cash invested into the case.
The review of this investment has identified two avenues for potential recovery of a material part of LCM's capital invested. Firstly, we believe that the firm of solicitors, who initially acted for the claimants in this claim, overcharged for legal services supplied to the claimants and we have commenced a costs assessment seeking reimbursement of a portion of the legal costs paid by LCM. Secondly, we are investigating a claim against those same solicitors for breach of contract and negligence in association with the legal services provided for the claim.
Post period end, LCM is awaiting the outcome of a trial in relation to a separate investment in UK commercial litigation, co-funded alongside Fund I, into which LCM has invested A$20.6 million of its own capital. The judgment is expected in early October.
Furthermore, having previously sought permission to appeal the commercial arbitration loss that was announced on 1 April 2025, LCM expects to hear if permission has been granted in the near term and will update the market accordingly.
Going Concern - Material Uncertainty
Given the number of adverse case outcomes in recent months, which have impacted cash inflows and increased indebtedness, the Directors have considered a range of scenarios, including plausible downside scenarios, and note that in certain circumstances, further case losses could lead to a breach of LCM's debt covenants.
LCM's lender has granted a debt covenant waiver through to 30 December 2025 and as part of this arrangement the interest rate on the loan increases by 2.00% per annum during the waiver period, and a one-time waiver fee equal to 1.50% of the principal amount outstanding will be payable.
While LCM's lender has been responsive in providing near-term covenant waivers to date, any further amendments, should they be required, will be subject to negotiation. This assessment is linked to a robust evaluation of the principal risks facing LCM and the potential impact of these risks being realised.
After considering LCM's forecasts, stress testing and available mitigating actions, and having regard to the inherent risks associated with the binary nature of LCM's investment model, the Directors have concluded that a material uncertainty exists which may cast significant doubt on LCM's ability to continue as a going concern.
The material uncertainty relates to LCM's ability to comply with its debt covenants in the event of certain adverse case outcomes. The Directors have a reasonable expectation, based on current discussions, that LCM will continue to receive the necessary support from its lender to allow it to continue in operational existence for the foreseeable future. Accordingly, the financial statements have been prepared on a going concern basis, whilst noting the material uncertainty above.
Key Performance Indicators
|
|
FY22 |
FY23 |
FY24 |
FY25 |
|
Funds under management (US$m) |
340 |
441 |
441 |
339 |
|
Track record (MOIC) |
2.6x |
2.8x |
2.9x |
2.0x |
|
New commitments (A$m) |
104 |
176 |
279 |
84 |
|
Committed capital |
414 |
484 |
724 |
611 |
|
Invested capital (in period) |
66 |
95 |
102 |
109 |
|
Cumulative invested capital (in ongoing cases) |
184 |
227 |
281 |
301 |
Consolidated statement of profit or loss and other comprehensive income
For the period ended 30 June 2025
|
|
|
Consolidated |
|
|||
|
|
|
2025 |
2024 |
|
||
|
|
Note |
$'000 |
$'000 |
|
||
|
|
|
|
|
|
||
|
Income |
|
|
|
|
||
|
Net realised gain on investments |
5 |
43,643 |
61,778 |
|
||
|
Net unrealised gain/(loss) on investments |
5 |
(206,767) |
25,149 |
|
||
|
Movement in financial liabilities related to third-party interests in consolidated entities |
5 |
90,133 |
(48,382) |
|
||
|
Litigation service revenue |
5 |
- |
12,443 |
|
||
|
Litigation service expense |
5 |
(5,468) |
(3,236) |
|
||
|
Total income/(loss) |
|
(78,459) |
47,752 |
|
||
|
|
|
|
|
|
||
|
|
|
|
|
|
||
|
Expenses |
|
|
|
|
||
|
Employee benefits expense |
6 |
(12,061) |
(11,471) |
|
||
|
Depreciation expense |
6 |
(93) |
(145) |
|
||
|
Corporate expenses |
6 |
(4,841) |
(5,171) |
|
||
|
Fund administration expense |
6 |
(1,965) |
(3,400) |
|
||
|
Foreign currency gains/(losses) |
6 |
3,027 |
(1,432) |
|
||
|
Total operating expenses |
(15,933) |
(21,619) |
||||
|
Operating profit/(loss) |
|
(94,392) |
26,133 |
|
||
|
Finance costs |
6 |
(7,295) |
(10,083) |
|
||
|
Profit/(loss) before income tax expense |
(101,687) |
16,050 |
||||
|
Income tax (expense)/benefit |
7 |
(28,774) |
(3,335) |
|
||
|
Profit/(loss) after income tax expense |
(72,913) |
12,715 |
||||
|
|
|
|
|
|
||
|
Other comprehensive income |
|
|
||||
|
Items that may be subsequently reclassified to profit and loss: |
|
|
||||
|
Movement in foreign currency translation reserve |
5,128 |
2,013 |
||||
|
Total comprehensive income for the period |
(67,785) |
14,728 |
||||
|
|
|
|
|
|
||
|
Profit/(loss) for the period is attributable to: |
|
|
||||
|
Owners of Litigation Capital Management Limited |
(72,913) |
12,715 |
||||
|
|
|
(72,913) |
12,715 |
|
||
|
Total comprehensive income for the period is attributable to: |
|
|
||||
|
Owners of Litigation Capital Management Limited |
(67,785) |
14,728 |
||||
|
|
|
(67,785) |
14,728 |
|
||
|
|
|
|
|
|
||
|
|
|
|
|
|
||
|
|
|
Cents |
Cents |
|
||
|
|
|
|
|
|
||
|
Basic earnings/(loss) per share |
8 |
(70.83) |
12.01 |
|
||
|
Diluted earnings/(loss) per share |
8 |
(70.83) |
11.33 |
|
||
|
|
|
|
|
|
||
The above Consolidated Statement of Profit or Loss and Other Comprehensive Income should be read in conjunction with accompanying Notes to the Financial Statements.
Consolidated statement of financial position
For the period ended 30 June 2025
|
|
|
Consolidated |
|
|
|
|
2025 |
2024 |
|
|
Note |
$'000 |
$'000 |
|
|
|
|
|
|
Assets |
|
|
|
|
Cash and cash equivalents |
9 |
18,447 |
68,113 |
|
Trade receivables |
10 |
1,786 |
10,986 |
|
Due from resolution of financial assets |
11 |
88,201 |
3,980 |
|
Contract costs |
12 |
47,988 |
42,072 |
|
Investments |
13,21 |
287,735 |
465,213 |
|
Property, plant and equipment |
135 |
157 |
|
|
Intangible assets |
|
439 |
305 |
|
Other assets |
|
827 |
977 |
|
Total assets |
|
445,558 |
591,803 |
|
|
|
|
|
|
|
|
|
|
|
Liabilities |
|
|
|
|
Trade and other payables |
14 |
10,508 |
30,376 |
|
Tax payable/(refund) |
|
(6) |
883 |
|
Employee benefits |
|
1,115 |
1,112 |
|
Borrowings |
15 |
77,747 |
61,917 |
|
Financial liabilities related to third-party interests in consolidated entities |
16 |
226,538 |
264,950 |
|
Deferred tax liability |
7 |
15,286 |
43,624 |
|
Total liabilities |
|
331,188 |
402,862 |
|
Net assets |
|
114,370 |
188,941 |
|
|
|
|
|
|
Equity |
|
|
|
|
Issued capital |
17 |
60,634 |
69,674 |
|
Treasury shares |
17 |
- |
(5,396) |
|
Reserves |
|
8,838 |
4,171 |
|
Retained earnings |
|
44,899 |
120,492 |
|
Parent interest |
|
114,370 |
188,941 |
|
Total equity |
|
114,370 |
188,941 |
The above Consolidated Statement of Financial Position should be read in conjunction with accompanying Notes to the Financial Statements.
Consolidated statement of changes in equity
For the period ended 30 June 2025
|
|
|
|
|
Share based |
Foreign |
|
|
|
Issued |
Treasury |
Retained |
payments |
currency |
Total |
|
|
capital |
shares |
earnings |
reserve |
translation |
equity |
|
Consolidated |
$'000 |
$'000 |
$'000 |
$'000 |
$'000 |
$'000 |
|
Balance at 1 July 2023 |
69,674 |
- |
112,753 |
2,440 |
(1,398) |
183,469 |
|
Profit after income tax expense for the period |
- |
- |
12,715 |
- |
- |
12,715 |
|
Other comprehensive income for the period |
- |
- |
- |
- |
2,013 |
2,013 |
|
|
|
|
|
|
|
|
|
Total comprehensive income for the period |
- |
- |
12,715 |
- |
2,013 |
14,728 |
|
|
|
|
|
|
|
|
|
Equity Transactions: |
|
|
|
|
|
|
|
Share-based payments (note 28) |
316 |
- |
- |
800 |
- |
1,116 |
|
Dividends paid (note 19) |
- |
- |
(4,976) |
- |
- |
(4,976) |
|
Treasury shares acquired (note 17) |
- |
(5,396) |
- |
- |
- |
(5,396) |
|
|
316 |
(5,396) |
(4,976) |
800 |
- |
(9,256) |
|
Balance at 30 June 2024 |
69,990 |
(5,396) |
120,492 |
3,240 |
615 |
188,941 |
|
|
|
|
|
|
|
|
|
|
|
|
|
Share based |
Foreign |
|
|
|
Issued |
Treasury |
Retained |
payments |
currency |
Total |
|
|
capital |
shares |
earnings |
reserve |
translation |
equity |
|
Consolidated |
$'000 |
$'000 |
$'000 |
$'000 |
$'000 |
$'000 |
|
Balance at 1 July 2024 |
69,990 |
(5,396) |
120,492 |
3,240 |
615 |
188,941 |
|
Loss after income tax expense for the period |
- |
- |
(72,913) |
- |
- |
(72,913) |
|
Other comprehensive income for the period |
- |
- |
- |
- |
5,128 |
5,128 |
|
Total comprehensive income for the period |
- |
- |
(72,913) |
- |
5,128 |
(67,785) |
|
|
|
|
|
|
|
|
|
Equity Transactions: |
|
|
|
|
|
|
|
Share-based payments (note 28) |
1,359 |
- |
- |
(146) |
- |
1,213 |
|
Dividends paid (note 19) |
- |
- |
(2,680) |
- |
- |
(2,680) |
|
Treasury shares acquired (note 17) |
- |
(4,458) |
- |
- |
- |
(4,458) |
|
Cancellation of treasury shares (note 17) |
(9,854) |
9,854 |
- |
- |
- |
- |
|
LSPs exercised and purchased by EBT (note 17) |
(860) |
- |
- |
- |
- |
(860) |
|
|
(9,356) |
- |
(2,680) |
(146) |
- |
(6,786) |
|
Balance at 30 June 2025 |
60,634 |
- |
44,899 |
3,094 |
5,744 |
114,370 |
The above Consolidated Statement of Changes in Equity should be read in conjunction with accompanying Notes to the Financial Statements.
Consolidated statement of cash flows
For the period ended 30 June 2025
|
|
|
Consolidated |
|
|
|
|
2025 |
2024 |
|
|
Note |
$'000 |
$'000 |
|
|
|
|
|
|
Cash flows from operating activities |
|
|
|
|
Proceeds from litigation contracts |
64,702 |
116,636 |
|
|
Payments for litigation contracts |
(128,166) |
(78,265) |
|
|
Payments to suppliers and employees |
(16,411) |
(16,337) |
|
|
Income tax paid |
|
(580) |
(2,830) |
|
Net cash from/(used in) operating activities |
|
(80,454) |
19,203 |
|
|
|
|
|
|
Cash flows from investing activities |
|
|
|
|
Payments for property, plant and equipment |
(6) |
(31) |
|
|
Payments for intangibles |
(200) |
(9) |
|
|
Refund/(payment) of security deposits |
(2) |
8 |
|
|
Net cash used in investing activities |
(207) |
(31) |
|
|
|
|
|
|
|
Cash flows from financing activities |
|
|
|
|
Payments for treasury shares |
17 |
(5,318) |
(5,396) |
|
Dividends paid |
19 |
(2,680) |
(4,976) |
|
Proceeds from borrowings |
15 |
25,039 |
- |
|
Repayments of borrowings |
15 |
(12,864) |
(8,139) |
|
Payments of finance costs |
(6,467) |
(8,960) |
|
|
Payments of placement fees related to third-party interests |
(1,033) |
(2,206) |
|
|
Contributions from third-party interests in consolidated entities |
16 |
67,106 |
30,505 |
|
Distributions to third-party interests in consolidated entities |
16 |
(33,959) |
(56,407) |
|
Net cash from/(used in) financing activities |
29,824 |
(55,578) |
|
|
|
|
|
|
|
Net decrease in cash and cash equivalents |
(50,838) |
(36,405) |
|
|
Cash and cash equivalents at the beginning of the period |
68,113 |
104,457 |
|
|
Effects of exchange rate changes on cash and cash equivalents |
1,171 |
61 |
|
|
Cash and cash equivalents at the end of the period |
9 |
18,447 |
68,113 |
The above Consolidated Statement of Cash Flows should be read in conjunction with accompanying Notes to the Financial Statements.
Notes to the financial statements
30 June 2025
Note 1. General information
The financial statements cover Litigation Capital Management Limited (the 'Company') as a Group consisting of Litigation Capital Management Limited and the entities it controlled at the end of, or during, the year (referred to as the 'Group'). The financial statements are presented in Australian dollars, which is Litigation Capital Management Limited's functional and presentation currency.
Litigation Capital Management Limited was admitted onto the Alternative Investment Market ('AIM') on 19 December 2018.
Litigation Capital Management Limited is a for profit publicly listed company limited by shares, incorporated and domiciled in Australia. Its registered office and principal place of business is:
Level 12, The Chifley Tower
2 Chifley Square
Sydney NSW 2000
A description of the nature of the Group's operations and its principal activities are included in the Directors' report, which is not part of the financial statements.
The financial statements were authorised for issue, in accordance with a resolution of Directors, on 1 October 2025. The Directors have the power to amend and reissue the financial statements.
Basis of preparation
The Financial Report:
· is a general purpose financial report;
· has been prepared in accordance with the Australian Accounting Standards adopted by the Australian Accounting Standards Board (AASB) and International Financial Reporting Standards (IFRSs) as issued by the International Accounting Standards Board (IASB);
· has been prepared in accordance with the requirements of the Corporations Act 2001 (Cth);
· is presented in Australian dollars, which is the Group's functional and presentation currency, with all values rounded to the nearest thousand dollars, or in certain cases to the nearest dollar, in accordance with ASIC Corporations Instrument 2016/191 unless otherwise indicated;
· includes foreign currency transactions that are translated into the functional currency, using the exchange rates prevailing at the date of the Financial Report;
· has been prepared on a going concern basis using a historical cost basis, except for certain assets and liabilities measured at fair value;
· presents assets and liabilities on the face of the Balance Sheets in decreasing order of liquidity;
· where required, presents restated comparative information for consistency with the current year's presentation in the Financial Report; and
· contains accounting policies that have been consistently applied to all periods presented, unless otherwise stated.
Principles of consolidation
The consolidated financial statements incorporate the assets and liabilities of all subsidiaries of Litigation Capital Management Limited ('Company' or 'parent entity') as at 30 June 2025 and the results of all subsidiaries for the year then ended. Litigation Capital Management Limited and its subsidiaries together are referred to in these financial statements as the 'Group'.
The Group includes fund investment vehicles over which the Group has the right to direct the relevant activities of the fund under contractual arrangements and has exposure to variable returns from the fund investment vehicles. See note 4.
Subsidiaries are all those entities over which the Group has control. The Group controls an entity when the Group is exposed to, or has rights to, variable returns from its involvement with the entity and has the ability to affect those returns through its power to direct the activities of the entity. Subsidiaries are fully consolidated from the date on which control is transferred to the Group. They are de-consolidated from the date that control ceases.
Intercompany transactions, balances and unrealised gains on transactions between entities in the Group are eliminated. Unrealised losses are also eliminated unless the transaction provides evidence of the impairment of the asset transferred. Accounting policies of subsidiaries have been changed where necessary to ensure consistency with the policies adopted by the Group.
Note 2. Material accounting policies
Accounting standards and interpretations
The accounting policies adopted are consistent with those followed in the preparation of the Group's annual consolidated financial statements for the year ended 30 June 2024.
New and amended accounting standards and interpretations issued but not yet effective
The new and amended standards and interpretations that are issued, but not yet effective, up to the date of issuance of the Group's financial statements that the Group reasonably expects will have an impact on its disclosures, financial position or performance when applied at a future date, are disclosed below.
• Amendment to IFRS 9 and IFRS 7 - Classification and Measurement of Financial Instruments
• IFRS 18 Presentation and Disclosure in Financial Statements
• IFRS 19 Subsidiaries without Public Accountability: Disclosures
• IFRS S1, General requirements for disclosure of sustainability-related financial information
• IFRS S2 Climate-related disclosures
The Group intends to adopt these new and amended standards and interpretations, if applicable, when they become effective. The Group has not listed other standards and interpretations which are issued but not yet effective, as they are not expected to impact the Group.
Going concern
Litigation Capital Management Limited and its wholly owned subsidiaries ("LCM") and the Group's fund structures ("Fund") have prepared the financial statements on the going concern basis, which contemplates continuity of normal business activities and the realisation of assets and discharge of liabilities in the normal course of business.
Given the number of adverse case outcomes in recent months, which have impacted cash inflows and increased indebtedness, the Directors have considered a range of scenarios, including plausible downside scenarios, and note that in certain circumstances, further case losses could lead to a breach of LCM's debt covenants.
While LCM's lender has been responsive in providing near-term covenant waivers to date, any further amendments, should they be required, will be subject to negotiation. This assessment is linked to a robust evaluation of the principal risks facing LCM and the potential impact of these risks being realised.
After considering LCM's forecasts, stress testing and available mitigating actions, and having regard to the inherent risks associated with the binary nature of LCM's investment model, the Directors have concluded that a material uncertainty exists which may cast significant doubt on LCM's ability to continue as a going concern.
The material uncertainty relates to LCM's ability to comply with its debt covenants in the event of certain adverse case outcomes. The Directors have a reasonable expectation, based on current discussions, that LCM will continue to receive the necessary support from its lender to allow it to continue in operational existence for the foreseeable future. Accordingly, the financial statements have been prepared on a going concern basis, whilst noting the material uncertainty above.
However, these events and conditions indicate that a material uncertainty exists which may cast significant doubt on LCM's ability to continue as a going concern, and therefore the entity may be unable to realise its assets and discharge its liabilities in the normal course of business and at the amounts stated in the financial report. The financial report does not include any adjustments relating to the amounts or classification of recorded assets or liabilities that might be necessary if LCM does not continue as a going concern.
Operating segments
Operating segments are presented using the 'management approach', where the information presented is on the same basis as the internal reports provided to the Chief Operating Decision Makers ('CODM'). The CODM is responsible for the allocation of resources to operating segments and assessing their performance.
Foreign currency translation
The financial statements are presented in Australian dollars, which is Litigation Capital Management Limited's functional and presentation currency.
Foreign currency transactions
Foreign currency transactions are translated into the entity's functional currency using the exchange rates prevailing at the dates of the transactions. Foreign exchange gains and losses resulting from the settlement of such transactions and from the translation at financial year-end exchange rates of monetary assets and liabilities denominated in foreign currencies are recognised in profit or loss.
Foreign operations
The assets and liabilities of foreign operations are translated into Australian dollars using the exchange rates at the reporting date. The revenues and expenses of foreign operations are translated into Australian dollars using the average exchange rates, which approximate the rates at the dates of the transactions, for the period. All resulting foreign exchange differences are recognised in other comprehensive income through the foreign currency reserve in equity.
The foreign currency reserve is recognised in profit or loss when the foreign operation or net investment is disposed of.
Fair value measurement
The Group measures its financial instruments such as litigation funding agreements and financial liabilities related to third-party interests at fair value at each balance sheet date.
When an asset or liability, financial or non-financial, is measured at fair value for recognition or disclosure purposes, the fair value is based on the price that would be received to sell an asset or paid to transfer a liability in an orderly transaction between market participants at the measurement date; and assumes that the transaction will take place either: in the principal market; or in the absence of a principal market, in the most advantageous market.
Fair value is measured using the assumptions that market participants would use when pricing the asset or liability, assuming they act in their economic best interests. For non-financial assets, the fair value measurement is based on its highest and best use. Valuation techniques that are appropriate in the circumstances and for which sufficient data are available to measure fair value, are used, maximising the use of relevant observable inputs and minimising the use of unobservable inputs.
The Group uses valuation techniques that are appropriate in the circumstances and for which sufficient data is available to measure fair value, maximising the use of relevant observable inputs and minimising the use of unobservable inputs.
All assets and liabilities for which fair value is measured or disclosed in the financial statements are categorised within the fair value hierarchy, described as follows, based on the lowest level input that is significant to the fair value measurement as a whole:
|
· |
Level 1 - Quoted (unadjusted) market prices in active markets for identical assets or liabilities |
|
· |
Level 2 - Valuation techniques for which the lowest level input that is significant to the fair value measurement is directly or indirectly observable |
|
· |
Level 3 - Valuation techniques for which the lowest level input that is significant to the fair value measurement is unobservable |
For assets and liabilities that are recognised in the financial statements at fair value on a recurring basis, the Group determines whether transfers have occurred between levels in the hierarchy by re-assessing categorisation (based on the lowest level input that is significant to the fair value measurement as a whole) at the end of each reporting period.
The Group's Executive Leadership Committee determines the policies and procedures for fair value measurement, including the litigation funding agreements. The Committee is comprised of the Chief Executive Officer, Chief Financial Officer and Head of Investments or equivalent.
The level of involvement of external valuers or specialist valuation experts is determined annually by the Committee after discussion with and approval by the Company's Audit Committee. Selection criteria include market knowledge, reputation, independence and whether professional standards are maintained.
At each reporting date, the Committee analyses the movements in the values of assets and liabilities which are required to be remeasured or re-assessed as per the Group's accounting policies. For this analysis, the Committee verifies the major inputs applied in the latest valuation by agreeing the information in the valuation computation to contracts and other relevant documents.
Fair-value related disclosures for financial instruments and non-financial assets that are measured at fair value or where fair values are disclosed, are summarised in the following notes:
|
· |
Disclosures for valuation methods, significant estimates and assumptions Note 21 |
|
· |
Quantitative disclosures of fair value measurement hierarchy Note 21 |
|
· |
Financial instruments Note 20 |
Litigation service
Revenue is recognised at the amount the Group expects to be entitled to in exchange for its services. For each customer contract, the Group identifies the performance obligations, determines the transaction price (including any variable consideration), and recognises revenue when the performance obligation is satisfied.
Variable consideration reflects the uncertainty of outcomes in awards, settlements or other contingent events. It is estimated using either the "expected value" or "most likely amount" method and recognised only when it is highly probable that a significant reversal will not occur. Until the uncertainty is resolved, amounts received that are subject to this constraint are recorded as refund liabilities.
The performance of a litigation service contract by the Group entails the management and progression of the litigation project during which costs are incurred by the Group over the life of the litigation project. As consideration for providing litigation management services and financing of litigation projects, the Group receives either a percentage of the gross proceeds of any award or settlement of the litigation, or a multiple of capital deployed, and is reimbursed for all invested capital.
Revenue, which includes amounts in excess of costs incurred and the reimbursement for all invested capital, is not recognised as revenue until the successful completion of the litigation project ie, complete satisfaction of the performance obligation, which is generally at the point in time when a judgment has been awarded or on an agreed settlement between the parties to the litigation, and therefore when the outcome is considered highly probable. On this basis, revenue is not recognised over time and instead recognised at the point in time when the Group satisfies the performance obligation. Costs include only external costs of funding the litigation, such as solicitors' fees, counsels' fees and experts' fees.
The terms and duration of each settlement or judgment varies by litigation project. Payment terms are not defined by the Group's litigation contracts however upon successful completion of a litigation project, being the satisfaction of the single performance obligation, funds are generally paid into trust within 28 days. The funds will remain in trust until the distribution amounts have been determined and agreed by the relevant parties, after which payment will be received by the Group.
Income tax
The income tax expense or benefit for the period is the tax payable on that period's taxable income based on the applicable income tax rate for each jurisdiction, adjusted by the changes in deferred tax assets and liabilities attributable to temporary differences, unused tax losses and the adjustment recognised for prior periods, where applicable.
Deferred tax assets and liabilities are recognised for temporary differences at the tax rates expected to be applied when the assets are recovered or liabilities are settled, based on those tax rates that are enacted or substantively enacted, except for:
|
· |
When the deferred income tax asset or liability arises from the initial recognition of goodwill or an asset or liability in a transaction that is not a business combination and that, at the time of the transaction, affects neither the accounting nor taxable profits; or |
|
· |
When the taxable temporary difference is associated with interests in subsidiaries, associates or joint ventures, and the timing of the reversal can be controlled and it is probable that the temporary difference will not reverse in the foreseeable future. |
Deferred tax assets are recognised for deductible temporary differences and unused tax losses only if it is probable that future taxable amounts will be available to utilise those temporary differences and losses.
The carrying amount of recognised and unrecognised deferred tax assets are reviewed at each reporting date. Deferred tax assets recognised are reduced to the extent that it is no longer probable that future taxable profits will be available for the carrying amount to be recovered. Previously unrecognised deferred tax assets are recognised to the extent that it is probable that there are future taxable profits available to recover the asset.
Deferred tax assets and liabilities are offset only where there is a legally enforceable right to offset current tax assets against current tax liabilities and deferred tax assets against deferred tax liabilities; and they relate to the same taxable authority on either the same taxable entity or different taxable entities which intend to settle simultaneously.
Litigation Capital Management Limited (the 'head entity') and its wholly-owned Australian subsidiaries have formed an income tax consolidated group under the tax consolidation regime. The head entity and each subsidiary in the tax consolidated group continue to account for their own current and deferred tax amounts. The tax consolidated group has applied the 'separate taxpayer within group' approach in determining the appropriate amount of taxes to allocate to members of the tax consolidated group.
In addition to its own current and deferred tax amounts, the head entity also recognises the current tax liabilities (or assets) and the deferred tax assets arising from unused tax losses and unused tax credits assumed from each subsidiary in the tax consolidated group.
Assets or liabilities arising under tax funding agreements with the tax consolidated entities are recognised as amounts receivable from or payable to other entities in the tax consolidated group. The tax funding arrangement ensures that the intercompany charge equals the current tax liability or benefit of each tax consolidated group member, resulting in neither a contribution by the head entity to the subsidiaries nor a distribution by the subsidiaries to the head entity.
Cash and cash equivalents
Cash and cash equivalents includes cash on hand, deposits held at call with financial institutions, other short-term, highly liquid investments with original maturities of three months or less that are readily convertible to known amounts of cash and which are subject to an insignificant risk of changes in value.
Trade and other receivables
Trade receivables are initially recognised at fair value and subsequently measured at amortised cost using the effective interest method, less any allowance for expected credit losses. Trade receivables generally do not have a specifically defined time frame for settlement, additionally, when the receivable is due from part of the portfolio of litigation projects, the settlement of the receivable is generally made upon an additional resolution of another litigation project within the portfolio which also may not be within a specifically defined time frame.
The Group has applied the simplified approach to measuring expected credit losses for trade receivables and contract assets, which uses a lifetime expected loss allowance. To measure the expected credit losses, trade receivables have been grouped based on days overdue.
Due from resolution of investments
Amounts due from the settlement of financial assets relate to the realisation of litigation funding assets that have been successfully concluded and where there is no longer any litigation risk remaining and represent the expected cash flow to be received by the Group. The settlement terms and timing of realisations vary by litigation funding asset. The majority of settlement balances are received shortly after the period end in which the litigation funding asset has concluded, and all settlement balances are generally expected to be received within 12 months after completion.
Contract costs
Contract costs are recognised as an asset when the Group incurs costs in fulfilling a contract and when all the following are met: (i) the costs relate directly to the contract; (ii) the costs generate or enhance resources of the Group that will be used to satisfy future performance obligations; and (iii) the costs are expected to be recovered. Contract costs are financial assets for impairment purposes. The Group's revenue recognition policy for litigation service revenue provides further information.
Investments
Investments are financial assets recognised at fair value through profit or loss and are fair valued using an income approach. Financial assets at fair value through profit or loss are carried in the statement of financial position at fair value with net changes in fair value recognised in the statement of profit or loss. This category includes the Group's litigation funding assets. The litigation funding assets are primarily derecognised when the underlying litigation resolves and transfers to Due from resolution of financial assets.
Financial assets are derecognised when the contractual rights to the cash flows expire or when the asset, along with the associated risks and rewards of ownership, are substantially transferred to another entity.
Financial liabilities related to third-party interests in consolidated entities
Non-controlling interests where the Group does not own 100% of a consolidated entity are recorded as financial liabilities related to third-party interests in consolidated entities. Financial liabilities related to third-party interests in consolidated entities are initially recognised at the fair value. Gains or losses on liabilities held at fair value through profit or loss are recognised in the statement of profit or loss as 'Movement in financial liabilities related to third-party interests in consolidated entities'. They are subsequently measured at fair value using an income approach. Amounts included in the consolidated statement of financial position represent the net asset value of the third-parties' interests. These amounts have been elected to be measured at fair value to reduce the accounting mismatch between the related financial asset measured at fair value through profit or loss.
Financial liabilities are derecognised when the obligation to settle through cash flows has expired or been transferred.
Impairment of non-financial assets
Non-financial assets are reviewed for impairment at each reporting date and whenever events or changes in circumstances indicate that the carrying amount may not be recoverable. An impairment loss is recognised for the amount by which the asset's carrying amount exceeds its recoverable amount.
Recoverable amount is the higher of an asset's fair value less costs of disposal and value-in-use. The value-in-use is the present value of the estimated future cash flows relating to the asset using a pre-tax discount rate specific to the asset or cash-generating unit to which the asset belongs. Assets that do not have independent cash flows are grouped together to form a cash-generating unit.
Trade and other payables
These amounts represent liabilities for goods and services provided to the Group prior to the end of the financial year and which are unpaid. Due to their short-term nature they are measured at amortised cost and are not discounted. The amounts are unsecured and are usually paid within 30 days of recognition.
Borrowings
Borrowings are initially recognised at fair value net of transaction costs incurred. Subsequent to initial recognition, borrowings are stated at amortised cost.
Net finance costs
Net finance costs comprise interest income from the investment of excess funds in short-term, highly liquid investments, and interest expense and borrowing costs related to the borrowing of funds.
Employee benefits
Short-term employee benefits
Liabilities for wages and salaries, including non-monetary benefits, annual leave and long service leave expected to be settled wholly within 12 months of the reporting date are measured at the amounts expected to be paid when the liabilities are settled.
Other long-term employee benefits
The liability for annual leave and long service leave not expected to be settled within 12 months of the reporting date are measured at the present value of expected future payments to be made in respect of services provided by employees up to the reporting date. Consideration is given to expected future wage and salary levels, experience of employee departures and periods of service. Expected future payments are discounted using market yields at the reporting date on high quality corporate bonds with terms to maturity and currency that match, as closely as possible, the estimated future cash outflows.
Superannuation expense
Contributions to superannuation are expensed in the period in which they are incurred.
Share-based payments
Equity-settled share-based compensation benefits are provided to employees.
Equity-settled transactions are awards of shares, or options over shares, that are provided to employees in exchange for the rendering of services.
The cost of equity-settled transactions are measured at fair value on grant date. Fair value is determined using either the Monte Carlo or Black-Scholes option pricing model that takes into account the exercise price, the term of the option, the impact of dilution, the share price at grant date and expected price volatility of the underlying share, the expected dividend yield and the risk free interest rate for the term of the option, together with non-vesting conditions that do not determine whether the Group receives the services that entitle the employees to receive payment. No account is taken of any other vesting conditions.
The cost of equity-settled transactions are recognised as an expense with a corresponding increase in equity over the vesting period. The cumulative charge to profit or loss is calculated based on the grant date fair value of the award, the best estimate of the number of awards that are likely to vest and the expired portion of the vesting period. The amount recognised in profit or loss for the period is the cumulative amount calculated at each reporting date less amounts already recognised in previous periods.
Market conditions are taken into consideration in determining fair value. Therefore any awards subject to market conditions are considered to vest irrespective of whether or not that market condition has been met, provided all other conditions are satisfied.
If equity-settled awards are modified, as a minimum an expense is recognised as if the modification has not been made. An additional expense is recognised, over the remaining vesting period, for any modification that increases the total fair value of the share-based compensation benefit as at the date of modification.
If the non-vesting condition is within the control of the Group or employee, the failure to satisfy the condition is treated as a cancellation. If the condition is not within the control of the Group or employee and is not satisfied during the vesting period, any remaining expense for the award is recognised over the remaining vesting period, unless the award is forfeited.
If equity-settled awards are cancelled, it is treated as if it has vested on the date of cancellation, and any remaining expense is recognised immediately. If a new replacement award is substituted for the cancelled award, the cancelled and new award may be treated as if they were a modification, depending on the specific circumstances of the award.
Issued capital
Ordinary shares are classified as equity. Incremental costs directly attributable to the issue of new shares or options are shown in equity as a deduction, net of tax, from the proceeds.
Treasury shares
Where Group purchase shares in the listed Company, the consideration paid is deducted from issued capital and the shares are treated as treasury shares until they are subsequently sold, reissued or cancelled. Where such shares are sold or reissued, any consideration received is included in shareholders' equity.
Dividends
Dividends are recognised when declared during the financial year and no longer at the discretion of the Company.
Earnings per share
Basic earnings per share
Basic earnings per share is calculated by dividing the profit attributable to the owners of Litigation Capital Management Limited, excluding any costs of servicing equity other than ordinary shares, by the weighted average number of ordinary shares outstanding during the financial year, adjusted for bonus elements in ordinary shares issued during the financial year.
Diluted earnings per share
Diluted earnings per share is calculated by adjusting the denominator used in the determination of basic earnings per share to include the weighted average number of ordinary shares outstanding and the effect of dilutive potential ordinary shares, such as share options and performance rights.
Note 3. Critical accounting judgements, estimates and assumptions
The preparation of the financial statements requires management to make judgements, estimates and assumptions that affect the reported amounts in the financial statements. Management continually evaluates its judgements and estimates in relation to assets, liabilities, contingent liabilities, revenue and expenses. Management bases its judgements, estimates and assumptions on historical experience and on other various factors, including expectations of future events, management believes to be reasonable under the circumstances. The resulting accounting judgements and estimates will seldom equal the related actual results. The judgements, estimates and assumptions that have a significant risk of causing a material adjustment to the carrying amounts of assets and liabilities (refer to the respective notes) within the next financial year are discussed below.
Key judgements
Consolidation of entities in which the Group holds less than 100% of interests
The Group has assessed the entities in which it has an interest to determine whether or not control exists and the entity is, therefore, consolidated into the Group (refer note 4). Where the Group does not own 100% of interests, the Group makes judgements to determine whether to consolidate the entity in question by applying the factors set forth in AASB 10, including but not limited to the Group's equity and economic ownership interest, the economic structures in use in the entity, the level of control the Group has over the entity through the entity's structure or any relevant contractual agreements, and the rights of other investors.
Significant estimates and assumptions
Net gains/(losses) on financial assets & liabilities at fair value through profit or loss
The Group carries its financial assets and liabilities at fair value, with changes in fair value being recognised in the statement of profit or loss. A valuation methodology based on an income approach.
The fair values of these financial assets and liabilities cannot be measured based on quoted prices in active markets, and as a result a fair value methodology is utilised. The measurement valuation technique includes a discounted cash flow (DCF) model based on the Group's estimated, risk adjusted future cash flows. The adopted discount rate reflects the funding cost of deploying capital, and is intended to capture the time value of money and market factors such as interest rates and foreign exchange rates.
The fair value framework incorporates assumptions, including the discount rate, the timing and amount of expected cash inflows and additional funding, and a risk-adjustment factor reflecting the inherent uncertainty in the cash flows due to litigation risk, which is dependent on observable case progression and milestones.
The inputs to these models are taken from observable markets where possible, but where this is not feasible, a degree of judgement is required in establishing fair values. Judgements include considerations of inputs such as case progress, credit risk and volatility. Changes in assumptions relating to these factors could affect the reported fair value of financial instruments.
The key assumptions used to determine the fair value of the litigation funding agreements, financial liabilities related to third-party interests in consolidated entities and sensitivity analyses are provided in note 21.
The Group refined its valuation methodology during the period. While the overall framework remains conceptually robust and consistent with industry practice, experience since implementation highlighted opportunities to enhance the setting of key assumptions so that valuations more accurately reflect the Group's risk profile. In particular, refinements were made to:
· Forecast returns: recalibrated to ensure they remain supportable in the context of historical outcomes and available market benchmarks;
· Expected duration: revised to be anchored to objective case milestones and extended to reflect observed delays in resolution; and
· Risk adjustment factors: updated so that recognition of value is more closely aligned to substantive external events rather than procedural steps.
These refinements result in a more conservative recognition profile and are intended to strengthen the robustness and consistency of the Group's fair value determinations. The Group has established a process for reviewing fair value assumptions on an annual basis, with the results of that review submitted to the Audit & Risk Committee in advance of the publication of annual results.
Note 4. Segment information
For management purposes, the Group is organised into two operating segments comprising the operations of Litigation Capital Management Limited and its wholly owned subsidiaries ("LCM") and the Group's fund structures ("Fund").
LCM
The LCM column includes the 25% co-investment in the Funds, Balance Sheet investments (ie, 100% investment by LCM) and corporate operations.
Fund I & II
This comprises LCM Global Alternative Returns Fund and LCM Global Alternative Returns Fund II and their entities as disclosed in note 27. AASB 10 Consolidated Financial Statements requires the Group to consolidate fund investment vehicles over which it has exposure to variable returns from the fund investment vehicles. As a result, third party interests in relation to the Funds have been consolidated in the financial statements. The Fund column includes the 75% co-investment in the litigation funding assets and costs of administering the funds.
The following tables reflect the impact of consolidating the results of the Funds with the results for LCM to arrive at the totals reported in the consolidated statement of profit or loss and other comprehensive income, consolidated statement of financial position and consolidated statement of cash flows.
Consolidated Statement of Comprehensive Income
|
|
2025 |
2024 |
|
||||
|
|
LCM |
Fund |
Consolidated |
LCM |
Fund |
Consolidated |
|
|
|
$'000 |
$'000 |
$'000 |
$'000 |
$'000 |
$'000 |
|
|
Income |
|
|
|
|
|
|
|
|
Net realised gain on investments |
22,187 |
21,456 |
43,643 |
23,033 |
38,744 |
61,778 |
|
|
Net unrealised gain/(loss) on investments |
(100,103) |
(106,664) |
(206,767) |
12,477 |
12,671 |
25,149 |
|
|
Movement in financial liabilities related to third-party interests in consolidated entities |
- |
90,133 |
90,133 |
- |
(48,382) |
(48,382) |
|
|
Litigation service revenue |
- |
- |
- |
12,443 |
- |
12,443 |
|
|
Litigation service expense |
(5,468) |
- |
(5,468) |
(3,236) |
- |
(3,236) |
|
|
Other income |
1,356 |
(1,356) |
- |
- |
- |
- |
|
|
Total income/(loss) |
(82,028) |
3,569 |
(78,459) |
44,718 |
3,033 |
47,752 |
|
|
|
|
|
|
|
|
|
|
|
Expenses |
|
|
|
|
|
|
|
|
Employee benefits expense |
(12,061) |
- |
(12,061) |
(11,471) |
- |
(11,471) |
|
|
Depreciation expense |
(93) |
- |
(93) |
(145) |
- |
(145) |
|
|
Corporate expenses |
(4,841) |
- |
(4,841) |
(5,171) |
- |
(5,171) |
|
|
Fund administration expense |
(1,033) |
(932) |
(1,965) |
(2,180) |
(1,220) |
(3,400) |
|
|
Foreign currency gains/(losses) |
5,663 |
(2,636) |
3,027 |
537 |
(1,968) |
(1,432) |
|
|
Total operating expenses |
(12,365) |
(3,569) |
(15,933) |
(18,430) |
(3,189) |
(21,619) |
|
|
Operating profit/(loss) |
(94,392) |
- |
(94,392) |
26,288 |
(155) |
26,133 |
|
|
Finance costs |
(7,295) |
- |
(7,295) |
(10,238) |
155 |
(10,083) |
|
|
Profit/(loss) before income tax expense |
(101,687) |
|
(101,687) |
16,050 |
- |
16,050 |
|
|
Income tax (expense)/benefit |
28,774 |
- |
28,774 |
(3,335) |
- |
(3,335) |
|
|
Profit/(loss) after income tax expense |
(72,913) |
- |
(72,913) |
12,715 |
- |
12,715 |
|
|
|
|
|
|
|
|
|
|
|
Other comprehensive income for the period, net of tax |
5,128 |
- |
5,128 |
2,013 |
- |
2,013 |
|
|
Total comprehensive income for the period |
(67,785) |
- |
(67,785) |
14,728 |
- |
14,728 |
|
Consolidated statement of financial position
|
|
2025 |
2024 |
|
|||||
|
|
LCM |
Fund |
Consolidated |
LCM |
Fund |
Consolidated |
|
|
|
|
$'000 |
$'000 |
$'000 |
$'000 |
$'000 |
$'000 |
|
|
|
|
|
|
|
|
|
|
|
|
|
|
|
|
|
|
|
|
|
|
|
Assets |
|
|
|
|
|
|
|
|
|
Cash and cash equivalents |
8,865 |
9,582 |
18,447 |
53,024 |
15,089 |
68,113 |
|
|
|
Trade & other receivables |
1,786 |
- |
1,786 |
10,986 |
- |
10,986 |
|
|
|
Due from resolution of financial assets |
28,824 |
59,377 |
88,201 |
3,980 |
- |
3,980 |
|
|
|
Contract costs |
47,988 |
- |
47,988 |
42,072 |
- |
42,072 |
|
|
|
Financial assets at fair value through profit or loss |
124,839 |
162,896 |
287,735 |
202,913 |
262,300 |
465,213 |
|
|
|
Property, plant and equipment |
135 |
- |
135 |
157 |
- |
157 |
|
|
|
Intangible assets |
439 |
- |
439 |
305 |
- |
305 |
|
|
|
Other assets |
1,174 |
(347) |
827 |
999 |
(22) |
977 |
|
|
|
Total assets |
214,050 |
231,508 |
445,558 |
314,436 |
277,367 |
591,803 |
|
|
|
|
|
|
|
|
|
|
|
|
|
|
|
|
|
|
|
|
|
|
|
Liabilities |
|
|
|
|
|
|
|
|
|
Trade and other payables |
5,538 |
4,970 |
10,508 |
17,959 |
12,417 |
30,376 |
|
|
|
Tax payable |
(6) |
- |
(6) |
883 |
- |
883 |
|
|
|
Employee Benefits |
1,115 |
- |
1,115 |
1,112 |
- |
1,112 |
|
|
|
Borrowings |
77,747 |
- |
77,747 |
61,917 |
- |
61,917 |
|
|
|
Third-party interests in consolidated entities |
- |
226,538 |
226,538 |
- |
264,950 |
264,950 |
|
|
|
Deferred tax liability |
15,286 |
- |
15,286 |
43,624 |
- |
43,624 |
|
|
|
Total liabilities |
99,680 |
231,508 |
331,188 |
125,494 |
277,367 |
402,862 |
|
|
|
Net assets |
114,370 |
- |
114,370 |
188,941 |
- |
188,941 |
|
|
A financial liability at fair value through the income statement is recognised in the parent entity in relation to the transactions entered into with certain Fund structures to support the financing of LFAs. These arrangements fail the derecognition principles in IFRS 9 and represents the net share of the overall LFA at fair value apportioned to the Funds.
Consolidated Statement of Cash Flows
|
|
2025 |
2024 |
||||
|
|
LCM |
Fund |
Consolidated |
LCM |
Fund |
Consolidated |
|
|
$'000 |
$'000 |
$'000 |
$'000 |
$'000 |
$'000 |
|
|
|
|
|
|
|
|
|
Cash flows from operating activities |
|
|
|
|
|
|
|
Proceeds from litigation contracts |
33,566 |
31,136 |
64,702 |
56,771 |
59,864 |
116,636 |
|
Payments for litigation contracts |
(59,762) |
(68,404) |
(128,166) |
(39,693) |
(38,572) |
(78,265) |
|
Payments to suppliers and employees |
(14,928) |
(1,482) |
(16,411) |
(14,765) |
(1,572) |
(16,337) |
|
Income tax paid |
(580) |
- |
(580) |
(2,830) |
- |
(2,830) |
|
Net cash from/(used in) operating activities |
(41,704) |
(38,750) |
(80,454) |
(517) |
19,720 |
19,203 |
|
|
|
|
|
|
|
- |
|
Cash flows from investing activities |
|
|
|
|
|
- |
|
Payments for property, plant and equipment |
(6) |
- |
(6) |
(31) |
- |
(31) |
|
Payments for intangibles |
(200) |
- |
(200) |
(9) |
- |
(9) |
|
Refund/(payment) of security deposits |
(2) |
- |
(2) |
8 |
- |
8 |
|
Net cash used in investing activities |
(207) |
- |
(207) |
(31) |
- |
(31) |
|
|
|
|
|
|
|
|
|
Cash flows from financing activities |
|
|
|
|
|
|
|
Payments for treasury shares |
(5,318) |
- |
(5,318) |
(5,396) |
- |
(5,396) |
|
Dividends paid |
(2,680) |
- |
(2,680) |
(4,976) |
- |
(4,976) |
|
Proceeds from borrowings |
25,039 |
- |
25,039 |
- |
- |
- |
|
Repayments of borrowings |
(12,864) |
- |
(12,864) |
(8,139) |
- |
(8,139) |
|
Payments of finance costs |
(6,467) |
- |
(6,467) |
(8,960) |
- |
(8,960) |
|
Payments of placement fees related to third-party interests |
(1,033) |
- |
(1,033) |
(2,206) |
- |
(2,206) |
|
Contributions from third-party interests in consolidated entities |
- |
67,106 |
67,106 |
- |
30,505 |
30,505 |
|
Distributions to third-party interests in consolidated entities |
- |
(33,959) |
(33,959) |
- |
(56,407) |
(56,407) |
|
Net cash from/(used in) financing activities |
(3,323) |
33,146 |
29,824 |
(29,677) |
(25,901) |
(55,578) |
|
|
|
|
|
|
|
|
|
Net decrease in cash and cash equivalents |
(45,234) |
(5,604) |
(50,838) |
(30,224) |
(6,181) |
(36,405) |
|
Cash and cash equivalents at the beginning of the period |
53,024 |
15,089 |
68,113 |
82,973 |
21,484 |
104,457 |
|
Effects of exchange rate changes on cash and cash equivalents |
1,075 |
97 |
1,171 |
275 |
(214) |
61 |
|
Cash and cash equivalents at the end of the period |
8,865 |
9,582 |
18,447 |
53,024 |
15,089 |
68,113 |
Note 5. Income
|
|
2025 |
2024 |
|||||
|
|
LCM |
Fund |
Consolidated |
LCM |
Fund |
Consolidated |
|
|
|
$'000 |
$'000 |
$'000 |
$'000 |
$'000 |
$'000 |
|
|
|
|
|
|
|
|
|
|
|
Net realised gain on investments |
|
|
|
|
|
|
|
|
Recoveries on resolved investments |
49,672 |
94,105 |
143,777 |
44,027 |
58,359 |
102,386 |
|
|
Capital invested on resolved investments |
(27,485) |
(72,649) |
(100,134) |
(20,994) |
(19,615) |
(40,609) |
|
|
|
22,187 |
21,456 |
43,643 |
23,033 |
38,744 |
61,778 |
|
|
|
|
|
|
|
|
|
|
|
Net unrealised gain/(loss) on investments |
|
|
|
|
|
|
|
|
Fair value removal on concluded investments |
(49,020) |
(44,997) |
(94,017) |
(32,962) |
(16,644) |
(49,605) |
|
|
Fair value write down on case losses under appeal |
(44,536) |
(41,773) |
(86,309) |
- |
- |
- |
|
|
Fair value movement on pre-hearing/trial ongoing investments1 |
(6,824) |
(21,292) |
(28,115) |
44,562 |
30,206 |
74,768 |
|
|
Foreign exchange movement on fair value |
276 |
1,398 |
1,674 |
877 |
(891) |
(14) |
|
|
|
(100,103) |
(106,664) |
(206,766) |
12,477 |
12,671 |
25,149 |
|
|
Total gain/(loss) on investments |
(77,915) |
(85,208) |
(163,124) |
35,511 |
51,416 |
86,925 |
|
|
Movement in financial liabilities related to third-party interests in consolidated entities |
- |
90,133 |
90,133 |
- |
(48,382) |
(48,382) |
|
|
Net gain from contract costs |
- |
- |
- |
9,207 |
- |
9,207 |
|
|
Other income |
1,356 |
(1,356) |
- |
- |
- |
- |
|
|
Total income/(loss) |
(76,560) |
3,569 |
(72,991) |
44,718 |
3,033 |
47,752 |
|
1 Refer note 3 for refinements made to the valuation methodology during the period
Effective from 1 July 2024, management has revised the presentation of income to provide greater transparency over the composition of realised and unrealised gains and losses. The revised disclosure provides greater transparency by disaggregating movements between LCM and the Fund, and by separately identifying recoveries and capital invested on resolved investments, fair value write-offs, fair value movements on ongoing investments, and foreign exchange movements. As a result, the comparative note disclosure for the year ended 30 June 2024 has been restated to reallocate amounts between line items. Importantly, the total income recognised for the prior period remains unchanged.
Realised gains relate to amounts where litigation risk has concluded and amounts are expected to be received by LCM. Unrealised gains or losses relate to the fair value movement of assets and liabilities associated with litigation contracts. The gain and loss related to third party interests in consolidated entities represents realised and unrealised gains and losses that relate to third party funded proportions from LCM controlled entities.
Litigation service
|
|
Consolidated |
|
|
|
2025 |
2024 |
|
|
$'000 |
$'000 |
|
|
|
|
|
Litigation service revenue |
- |
12,443 |
|
Litigation service expense |
(5,468) |
(3,236) |
|
|
(5,468) |
9,207 |
|
Major service lines |
|
|
|
Revenue attributable to LCM |
- |
12,443 |
|
Attributable to third party interests |
- |
- |
|
|
- |
12,443 |
|
Geographical regions |
|
|
|
Australia |
- |
12,443 |
|
|
- |
12,443 |
Litigation service revenue relates to an individual litigation asset which resolved during the period and had a contract duration of more than 4 years.
Note 6. Profit/(loss) before tax
|
|
Consolidated |
|
|
|
2025 |
2024 |
|
|
$'000 |
$'000 |
|
|
|
|
|
Profit/(loss) before income tax expense includes the following specific expenses: |
|
|
|
|
|
|
|
Employee benefits expense |
|
|
|
Salaries & wages |
9,021 |
8,513 |
|
Non-Executive directors' fees |
420 |
457 |
|
Superannuation and pension |
292 |
311 |
|
Share based payments expense |
1,117 |
1,116 |
|
Other employee benefits & costs |
1,210 |
1,074 |
|
|
12,061 |
11,471 |
|
Depreciation |
|
|
|
Plant and equipment |
28 |
84 |
|
Intangible assets |
65 |
60 |
|
|
93 |
145 |
|
Corporate expenses |
|
|
|
Corporate & secretary expenses |
435 |
322 |
|
General & Administrative Expenses |
208 |
228 |
|
Insurance |
337 |
419 |
|
Marketing & Advertising |
68 |
345 |
|
Occupancy Costs |
902 |
906 |
|
Other expenses |
183 |
284 |
|
Professional fees |
1,534 |
2,012 |
|
Travel & entertainment expenses |
1,174 |
656 |
|
|
4,841 |
5,171 |
|
Fund administration expense |
|
|
|
General administration expenses |
932 |
1,220 |
|
Placement fees |
1,033 |
2,180 |
|
|
1,965 |
3,400 |
|
Foreign currency gains/(losses) |
|
|
|
Realised foreign exchange loss |
1,053 |
2,934 |
|
Unrealised foreign exchange gain |
(4,080) |
(1,502) |
|
|
(3,027) |
1,432 |
|
Finance costs |
|
|
|
Net interest on borrowings |
6,750 |
9,017 |
|
Net finance costs of third-party interests |
- |
(155) |
|
Other finance costs |
545 |
1,221 |
|
|
7,295 |
10,083 |
Note 7. Income tax expense
|
|
Consolidated |
|
|
|
2025 |
2024 |
|
|
$'000 |
$'000 |
|
Numerical reconciliation of income tax expense and tax at the statutory rate |
|
|
|
Profit/(loss) before income tax expense |
(101,687) |
16,050 |
|
|
|
|
|
At the Group's statutory income tax rate of 30% (2024: 30%) |
(30,506) |
4,815 |
|
|
|
|
|
Tax effect amounts which are not deductible/(taxable) in calculating taxable income: |
|
|
|
Foreign tax rate adjustments |
3,863 |
(2,385) |
|
Share-based payments |
52 |
335 |
|
Other assessable income |
181 |
139 |
|
Other non-deductible expenses |
(2,092) |
215 |
|
Adjustment in respect of income and deferred tax of previous years |
(272) |
217 |
|
Income tax expense / (benefit) |
(28,774) |
3,335 |
|
|
Consolidated |
|
|
|
2025 |
2024 |
|
|
$'000 |
$'000 |
|
|
|
|
|
Current tax |
(437) |
(4,030) |
|
Deferred tax |
(28,337) |
7,365 |
|
Income tax expense / (benefit) |
(28,774) |
3,335 |
|
|
|
|
|
|
Consolidated |
|
|
|
2025 |
2024 |
|
|
$'000 |
$'000 |
|
Deferred tax asset/(liability) |
|
|
|
Deferred tax asset/(liability) comprises temporary differences attributable to: |
|
|
|
|
|
|
|
Tax losses |
643 |
- |
|
Interest deductions denied |
2,623 |
- |
|
Employee benefits |
333 |
302 |
|
Accrued expenses |
80 |
172 |
|
Expenditure deductible for income tax over time |
1,356 |
1,706 |
|
Share based payments |
788 |
464 |
|
Deductible funding on contract costs and financial assets |
(17,102) |
(16,634) |
|
Fair value adjustments to financial assets |
(4,008) |
(29,634) |
|
Deferred tax asset/(liability) |
(15,286) |
(43,624) |
|
|
|
|
|
Movements: |
|
|
|
Opening balance |
(43,624) |
(36,259) |
|
Charged to profit or loss |
28,337 |
(7,365) |
|
Closing balance |
(15,286) |
(43,624) |
Note 8. Earnings/(loss) per share
|
|
2025 |
2024 |
|
|
$'000 |
$'000 |
|
|
|
|
|
Profit/(loss) after income tax |
(72,913) |
12,715 |
|
Profit/(loss) after income tax attributable to the owners of Litigation Capital Management Limited |
(72,913) |
12,715 |
|
|
|
|
|
|
Number |
Number |
|
Weighted average number of ordinary shares used in calculating basic earnings per share1 |
102,942,667 |
105,849,093 |
|
Adjustments for calculation of diluted earnings per share: |
|
|
|
Amounts uncalled on partly paid shares |
- |
1,301,770 |
|
Options over ordinary shares |
- |
5,103,344 |
|
Weighted average number of ordinary shares used in calculating diluted earnings per share |
102,942,667 |
112,254,207 |
|
|
|
|
|
1 Weighted average number of ordinary shares on issue during the year, excludes treasury shares held |
||
|
|
|
|
|
|
Cents |
Cents |
|
Basic earnings/(loss) per share |
(70.83) |
12.01 |
|
Diluted earnings/(loss) per share |
(70.83) |
11.33 |
Dilutive potential shares which are contingently issuable are only included in the calculation of diluted earnings per share where the conditions are met. As at 30 June 2025, there were 6,107,174 shares calculated for inclusion in diluted earnings per share, however these were not included due to their anti-dilutive effect.
Note 9. Cash and cash equivalents
|
|
Consolidated |
|
|
|
2025 |
2024 |
|
|
$'000 |
$'000 |
|
Cash at Bank |
8,865 |
22,963 |
|
Investment securities held for liquidity purposes |
- |
30,061 |
|
Cash of third-party interests in consolidated entities |
9,582 |
15,089 |
|
|
18,447 |
68,113 |
Cash of third-party interests in consolidated entities is restricted as it is held within the fund investment vehicles on behalf of the third-party investors in these vehicles. The cash is restricted to use cashflows in the litigation funding assets made on their behalf and costs of administering the fund.
Note 10. Trade receivables
|
|
Consolidated |
|
|
|
2025 |
2024 |
|
|
$'000 |
$'000 |
|
|
|
|
|
Due from litigation service |
1,786 |
10,986 |
|
|
1,786 |
10,986 |
As at 30 June 2025, trade receivables are expected to be settled within 12 months after the Balance Sheet date.
Allowance for expected credit losses
The Group has recognised a loss of $nil (2024: $nil) in profit or loss in respect of the expected credit losses for the year ended 30 June 2025.
Note 11. Due from resolution of investments
|
|
2025 |
2024 |
||||||
|
|
LCM |
Fund |
Consolidated |
LCM |
Fund |
Consolidated |
|
|
|
|
$'000 |
$'000 |
$'000 |
$'000 |
$'000 |
$'000 |
|
|
|
|
|
|
|
|
|
|
|
|
|
At start of period |
3,980 |
- |
3,980 |
11,873 |
- |
11,873 |
|
|
|
Recoveries on resolved investments (note 5) |
49,672 |
94,105 |
143,777 |
44,027 |
58,359 |
102,386 |
|
|
|
Reimbursement of deployed capital |
901 |
- |
901 |
527 |
1,460 |
1,987 |
|
|
|
Proceeds from litigation funding assets |
(23,686) |
(31,136) |
(54,821) |
(52,480) |
(60,303) |
(112,782) |
|
|
|
Foreign exchange gain |
(2,043) |
(3,592) |
(5,635) |
32 |
483 |
516 |
|
|
|
Balance as at end of period |
28,824 |
59,377 |
88,201 |
3,980 |
- |
3,980 |
|
|
Effective from 1 July 2024, management has revised the presentation of amounts due from resolution of investments to provide greater transparency over the drivers of movements. The revised disclosure provides greater transparency by disaggregating movements between LCM and the Fund, and by separately identifying recoveries on resolved investments, proceeds from litigation funding assets, and foreign exchange effects. As a result, the comparative note disclosure for the year ended 30 June 2024 has been restated to reallocate amounts between line items. Importantly, the overall balance of amounts due from resolution of financial assets at the end of the prior period remains unchanged.
As at 30 June 2025, amounts due from resolution of financial assets are expected to be settled within 12 months after the Balance Sheet date.
Note 12. Contract costs - litigation contracts
|
|
2025 |
2024 |
|
|
$'000 |
$'000 |
|
|
|
|
|
Contract costs - litigation contracts |
47,988 |
42,072 |
There are a small number of legacy investments which are still being recorded under AASB 15 Revenue from Contracts with Customers due to the timing the contracts were entered into. These are expected to resolve in the short to medium term.
Reconciliation of litigation contract costs
Reconciliation of the contract costs at the beginning and end of the current period and previous financial year are set out below:
|
|
2025 |
2024 |
|
|
$'000 |
$'000 |
|
Balance at 1 July |
42,072 |
37,277 |
|
Additions during the period |
11,384 |
8,030 |
|
Realisations of contract assets |
(5,468) |
(3,236) |
|
Balance as at end of period |
47,988 |
42,072 |
Additions during the year relate to matters that progressed to trial, which required significant investment in their final stages.
The Group has recognised impairment losses of $5,468 (2024: $nil) in profit or loss on contract costs for the period ended 30 June 2025.
Note 13. Investments
|
|
2025 |
2024 |
||||||
|
|
LCM |
Fund |
Consolidated |
LCM |
Fund |
Consolidated |
|
|
|
|
$'000 |
$'000 |
$'000 |
$'000 |
$'000 |
$'000 |
|
|
|
|
|
|
|
|
|
|
|
|
|
At start of period |
202,913 |
262,300 |
465,213 |
165,768 |
225,642 |
391,410 |
|
|
|
Deployments |
35,969 |
60,165 |
96,134 |
43,393 |
47,523 |
90,916 |
|
|
|
Capital realised during the period (note 5) |
(27,485) |
(72,649) |
(100,134) |
(20,994) |
(19,615) |
(40,609) |
|
|
|
Fair value removal on concluded investments (note 5) |
(49,020) |
(44,997) |
(94,017) |
(32,962) |
(16,644) |
(49,605) |
|
|
|
Fair value write down on case losses under appeal (note 5) |
(44,536) |
(41,773) |
(86,309) |
- |
- |
- |
|
|
|
Fair value movement on pre-hearing/trial ongoing investments (note 5) |
(6,824) |
(21,292) |
(28,115) |
44,562 |
30,206 |
74,768 |
|
|
|
Foreign exchange movements |
13,820 |
21,142 |
34,962 |
3,146 |
(4,813) |
(1,667) |
|
|
|
Balance as at end of period |
124,839 |
162,896 |
287,735 |
202,913 |
262,300 |
465,213 |
|
|
Effective from 1 July 2024, management has revised the presentation of litigation funding assets, which are now disclosed under the heading Investments (previously titled Litigation Funding Assets at fair value through profit or loss). The revised disclosure provides greater transparency by disaggregating movements between LCM and the Fund, and by separately identifying capital realised, fair value write-offs on resolved and ongoing investments, and foreign exchange effects. As a result, the comparative note disclosure for the year ended 30 June 2024 has been restated to reallocate amounts between line items. Importantly, the overall balance of these assets at the end of the prior period remains unchanged.
Investments are financial instruments that relate to the provision of capital in connection with legal finance. The Group fund through both direct investments as well as using third party capital via a fund management model. The table above sets forth the changes in litigation funding assets at the beginning and end of the relevant reporting periods.
Note 14. Trade and other payables
|
|
Consolidated |
|
|
|
2025 |
2024 |
|
|
$'000 |
$'000 |
|
Trade payables |
10,227 |
29,789 |
|
Other payables |
281 |
587 |
|
|
10,508 |
30,376 |
Refer to note 20 for further information on financial instruments, including the Group's exposure to liquidity risk.
Note 15. Borrowings
|
|
Consolidated |
|
|
|
2025 |
2024 |
|
|
$'000 |
$'000 |
|
Borrowings |
77,747 |
61,917 |
|
|
77,747 |
61,917 |
|
Reconciliation of borrowings of LCM: |
|
||
|
|
2025 |
2024 |
|
|
|
$'000 |
$'000 |
|
|
Balance 1 July |
61,917 |
68,976 |
|
|
Proceeds from borrowings |
25,039 |
- |
|
|
Repayment of borrowings |
(12,864) |
(8,139) |
|
|
Payments for borrowing costs |
(487) |
(819) |
|
|
Net accrued interest |
5 |
648 |
|
|
Amortisation |
611 |
1,221 |
|
|
Other non-cash items |
1,522 |
- |
|
|
Balance as at end of period |
2,005 |
29 |
|
|
|
77,747 |
61,917 |
|
On 2 December 2024, LCM refinanced its credit facility with Northleaf Capital Partners for an initial amount of US$75,000,000, AUD equivalent of $114,136,0001 (the "Facility"), with a potential to upsize by a further US$75,000,000 (total US$150,000,000, AUD equivalent $228,272,000).
Interest is calculated by reference to the applicable currency benchmark, being the US Federal Funds Rate for USD drawings, the Bank Bill Swap Reference Rate (BBSY) for AUD drawings, and SONIA for GBP drawings (with fallback to the Bank of England base rate), together with a 5.25% margin.
The Facility has an overall term of four years and is secured against LCM's assets. As at 30 June 2025, LCM's outstanding utilisation amounted to US$23,922,000 on the initial credit facility, an AUD equivalent of $36,406,0001.
LCM agreed to various debt covenants including a minimum effective net tangible worth, borrowings as a percentage of effective net tangible worth, minimum liquidity, a minimum consolidated EBIT and a minimum multiple of invested capital on concluded contract assets over a specified period. There have been no defaults or breaches related to the Facility during the period ended 30 June 2025. Should LCM not satisfy any of these covenants, the outstanding balance of the Facility may become due and payable.
LCM incurred costs in relation to arranging the Facility of $792,000 which were reflected transactions costs and will be amortised over the 4 year term of the borrowings. As at 30 June 2025, $685,000 of these loan arrangement fees remained outstanding.
1 Converted at the functional currency spot rates of exchange at the reporting date
Note 16. Financial liabilities related to third-party interests in consolidated entities
|
|
2025 |
2024 |
|
|
$'000 |
$'000 |
|
Balance 1 July |
264,950 |
243,990 |
|
Proceeds - capital contributions from Limited Partners |
67,106 |
30,505 |
|
Payments - distributions to Limited Partners |
(33,959) |
(56,407) |
|
Movement on financial liabilities related to third-party interests in consolidated entities (note 5) |
(90,133) |
48,382 |
|
Non-cash movements in third-party assets and liabilities |
9,705 |
2,766 |
|
Foreign exchange movements |
8,869 |
(4,288) |
|
Balance as at end of period |
226,538 |
264,950 |
Note 17. Equity - issued capital
|
|
2025 |
2024 |
2025 |
2024 |
|
|
Shares |
Shares |
$'000 |
$'000 |
|
Ordinary shares - fully paid |
102,690,913 |
104,118,534 |
61,494 |
69,990 |
|
Ordinary shares - under loan share plan |
11,590,384 |
12,331,148 |
(860) |
- |
|
|
114,281,297 |
116,449,682 |
60,634 |
69,990 |
|
|
|
|
|
|
|
|
2025 |
2024 |
||
|
Movements in ordinary share capital |
Shares |
$'000 |
Shares |
$'000 |
|
Balance at 1 July |
104,118,534 |
69,990 |
106,613,927 |
69,674 |
|
Options exercised |
740,764 |
1,359 |
255,257 |
316 |
|
Share Buy-Back Programme (treasury shares) |
(2,168,385) |
- |
(2,750,650) |
- |
|
Treasury shares cancelled |
- |
(9,854) |
- |
- |
|
Balance at period end |
102,690,913 |
61,494 |
104,118,534 |
69,990 |
|
|
|
|
|
|
The Group's share buyback programme which commenced on 5 October 2023, completed on 8 November 2024.
Movements in ordinary shares issued under loan share plan ('LSP') and held by Employee Benefit Trust:
|
|
2025 |
2024 |
||
|
|
Shares |
$'000 |
Shares |
$'000 |
|
Balance at 1 July |
12,331,148 |
- |
12,586,405 |
- |
|
Options exercised |
(666,547) |
- |
(255,257) |
- |
|
LSPs exercised |
(858,736) |
- |
- |
- |
|
LSPs purchased by EBT |
784,519 |
(860) |
- |
- |
|
Balance at period end |
11,590,384 |
(860) |
12,331,148 |
- |
|
|
|
|
|
|
Reconciliation of ordinary shares issued under LSP:
|
|
2025 |
2024 |
|
Total shares allocated under existing LSP arrangements with underlying LSP shares (note 28) |
6,642,872 |
7,501,608 |
|
Less shares allocated under existing LSP arrangements without underlying LSP shares (note 28) |
(221,467) |
(221,467) |
|
Shares held by LCM Employee Benefit Trust for future allocation under employee share and option plans |
5,168,979 |
5,051,007 |
|
|
11,590,384 |
12,331,148 |
Ordinary shares
Ordinary shares entitle the holder to participate in dividends and the proceeds on the winding up of the Company in proportion to the number of and amounts paid on the shares held. The fully paid ordinary shares have no par value and the Company does not have a limited amount of authorised capital.
On a show of hands every member present at a meeting in person or by proxy shall have one vote and upon a poll each share shall have one vote.
Ordinary shares - under loan share plan ('LSP')
The Company has an equity scheme pursuant to which certain employees may access a LSP. The acquisition of shares under this LSP is fully funded by the Company through the granting of a limited recourse loan. The shares under LSP are restricted until the loan is repaid. The underlying options within the LSP have been accounted for as a share-based payment. Refer to note 28 for further details. When the loans are settled the shares are reclassified as fully paid ordinary shares and the equity will increase by the amount of the loan repaid.
Ordinary shares - held by Employee Benefit Trust
The Employee Benefit Trust ('EBT') holds performance related shareholdings awarded to former executive which did not vest. The Trust holds 5,168,979 shares which remain unallocated as at 30 June 2025 (2024: 5,051,007).
Ordinary shares - partly paid
As at 30 June 2025, there are currently 1,433,022 partly paid shares issued at an issue price of $0.17 per share. No amount has been paid up and the shares will become fully paid upon payment to the Company of $0.17 per share. As per the terms of issue, the partly paid shares have no maturity date and the amount is payable at the option of the holder.
Partly paid shares entitle the holder to participate in dividends and the proceeds of the Company in proportion to the number of and amounts paid on the shares held. The partly paid shares do not carry the right to participate in new issues of securities. Partly paid shareholders are entitled to receive notice of any meetings of shareholders. The partly paid shareholders are entitled to vote in the same proportion as the amounts paid on the partly paid shares bears to the total amount paid and payable.
Treasury shares
As at 30 June 2025, there were nil treasury shares (2024: 2,750,650) which has resulted in nil being deducted from equity (2024: $5,396,000). Treasury shares comprised shares bought back from shareholders which were held by Canaccord on behalf of LCM and classified as treasury shares. All treasury shares were cancelled in November 2024.
Capital risk management
The Group's objectives when managing capital is to safeguard its ability to continue as a going concern, so that it can provide returns for shareholders and benefits for other stakeholders and to maintain an optimum capital structure to reduce the cost of capital.
Capital is regarded as total equity as recognised in the statement of financial position.
In order to maintain or adjust the capital structure, the Group may adjust the amount of dividends paid to shareholders, return capital to shareholders, issue new shares or sell assets to reduce debt.
The capital risk management policy remains unchanged from the 30 June 2024 Annual Report.
Note 18. Equity - reserves
Movements in reserves
Movements in each class of reserve during the current and previous financial year are set out below:
|
Consolidated |
Share based |
Foreign |
Total |
|
|
payments |
currency |
reserves |
|
|
reserve |
translation |
|
|
|
$'000 |
$'000 |
$'000 |
|
Balance at 1 July 2023 |
2,440 |
(1,398) |
1,042 |
|
Movements in reserves during the period |
800 |
2,013 |
2,813 |
|
Balance at 30 June 2024 |
3,240 |
615 |
3,855 |
|
Movements in reserves during the period |
(146) |
5,128 |
4,983 |
|
Balance at 30 June 2025 |
3,094 |
5,743 |
8,838 |
Share-based payments reserve
The reserve is used to recognise the value of equity benefits provided to employees and Directors as part of their remuneration, and other parties as part of their compensation for services.
Foreign currency translation reserve
This reserve is used to record differences on the translation of the assets and liabilities of foreign operations.
Note 19. Equity - dividends
|
|
2025 |
2024 |
|
|
$'000 |
$'000 |
|
Ordinary dividend paid (2025: 1.25 cents, 2024: 2.25 cents) |
2,680 |
4,976 |
Franking credits
The franking credits available to the Group as at 30 June 2025 are $5,000 (2024: $338,000).
Note 20. Financial instruments
Financial risk management objectives
The Group's activities expose it to a variety of financial risks: market risk (including foreign currency risk, price risk and interest rate risk), credit risk and liquidity risk. The Group's overall risk management program focuses on the unpredictability of financial markets and seeks to minimise potential adverse effects on the financial performance of the Group. The Group uses different methods to measure different types of risk to which it is exposed. These methods include sensitivity analysis in the case of interest rate, foreign exchange and other price risks and ageing analysis for credit risk.
Risk management is carried out by senior finance executives ('finance') under policies approved by the Board of Directors ('the Board'). These policies include identification and analysis of the risk exposure of the Group and appropriate procedures, controls and risk limits. Finance identifies, evaluates and hedges financial risks within the Group's operating units. Finance reports to the Board on a monthly basis.
Financial instruments of the Group is comprised of litigation funding assets classified as financial assets at FVTPL and financial liabilities at FVTPL related to third party interests with the remaining financial instruments held at amortised cost.
Market risk
Foreign currency risk
The carrying amount of the Group's foreign currency denominated financial assets and financial liabilities at the reporting date were as follows:
|
|
Assets |
Liabilities |
Assets |
Liabilities |
|
|
2025 |
2025 |
2024 |
2024 |
|
Consolidated |
$'000 |
$'000 |
$'000 |
$'000 |
|
|
|
|
|
|
|
US dollars |
123,298 |
(41,950) |
168,570 |
(68,550) |
|
Pound Sterling |
9,359 |
(20,150) |
2,751 |
(437) |
|
Singapore Dollars |
469 |
- |
24 |
(20) |
|
Other |
60 |
(72) |
7 |
(4) |
|
|
133,186 |
(62,172) |
171,352 |
(69,012) |
The Group had net assets denominated in foreign currencies of $71,014,000 (assets of $133,186,000 less liabilities of $62,172,000) as at 30 June 2025 (2024: net assets $102,340,000). Based on this exposure, had the Australian dollars weakened or strengthened by 10% against these foreign currencies with all other variables held constant, the Group's profit before tax for the year would have increased and decreased respectively by $7,101,000 (2024: $10,234,000). The percentage change is the expected overall volatility of the significant currencies, which is based on management's assessment of reasonable possible fluctuations taking into consideration movements over the last 12 months. The actual realised foreign exchange loss for the year ended 30 June 2025 was $1,053,000 (2024: loss of 2,934,000). The movement in the foreign currency translation reserve for the year ended 30 June 2025 was a gain of $5,128,000 (2024: gain $2,013,000).
Foreign exchange risk arises mainly from litigation funding assets and borrowings which are denominated in a currency that is not the functional currency in which they are measured. The risk is monitored using sensitivity analysis and cash flow forecasting. The Group's contract cost assets are not hedged as those currency positions are considered to be long term in nature.
Interest rate risk
The Group is exposed to changes in market interest rates primarily through:
· Cash holdings with a floating interest rate; and
· A US$75,000,000 million (AUD equivalent of $114,136,0001) variable rate debt facility, which includes fixed capitalised borrowing costs as at 30 June 2025.
As disclosed in Note 15, LCM refinanced its credit facility with Northleaf Capital Partners on 2 December 2024. The four-year facility bears interest at the relevant rate plus 5.25% and replaced the Group's previous fixed-rate borrowings, creating new exposure to variable interest rate risk.
At 30 June 2025, the Group's financial instruments subject to variable interest rate risk were:
|
|
2025 |
2024 |
|
|
$'000 |
$'000 |
|
Cash & cash equivalents |
18,447 |
68,113 |
|
Borrowings |
(77,747) |
- |
|
Net exposure |
(59,300) |
68,113 |
The Group monitors interest rate exposures across all currencies, considering expected market movements, cash requirements, refinancing options and the mix of fixed and variable rate borrowings.
The following sensitivity analysis is based on the interest rate risk exposures in existence at the reporting date.
At 30 June 2025, if interest rates had moved with all other variables held constant, post-tax profit and equity would have been affected as follows:
|
|
Post tax profit |
Equity |
||
|
|
2025 |
2024 |
2025 |
2024 |
|
|
$'000 |
$'000 |
$'000 |
$'000 |
|
|
|
|
|
|
|
100bps higher interest rates |
(415) |
477 |
(415) |
477 |
|
100bps lower interest rates |
415 |
(477) |
415 |
(477) |
Credit risk
Credit risk refers to the risk that on becoming contractually entitled to a settlement or award a defendant will default on its contractual obligation to pay resulting in financial loss to the Group. The Group assesses the defendants in the matters funded by the Group prior to entering into any agreement to provide funding and continues this assessment during the course of funding. Whenever possible the Group ensures that security for settlements sums is provided, or the settlements funds are placed into solicitors' trust accounts. However, the Group's continual monitoring of the defendants' financial capacity mitigates this risk.
The maximum credit risk exposure represented by cash, cash equivalents, trade and other receivables, due from resolution of financial assets and contract costs is specified in the consolidated statements of financial position. The exposure for financial assets held at amortised cost is the carrying amount, net of any provisions for impairment of those assets, which includes cash, cash equivalents and trade and other receivables. The Group does not hold any collateral. For financial assets measured at fair value, credit risk is incorporated into the valuation techniques applied (refer note 21).
To mitigate credit risk on cash and cash equivalents, the Group holds cash with Australian and American financial institutions with at least an AA- credit rating.
The Group applies the simplified approach to recognise impairment on settlement and receivable balances based on the lifetime expected credit loss at each reporting date. The Group reviews the lifetime expected credit loss rate based on historical collection performance, the specific provisions of any settlement agreement, assessments of recoverability during the due diligence process and a forward-looking assessment of macro-economic factors however note that the Group's operations are generally uncorrelated to market conditions and therefore has little to no impact on the recoverability of the Group's financial assets.
For trade receivables and due from resolution of financial assets, at every reporting date, the Group evaluates whether the trade receivables and due from resolution of financial assets is considered to have low credit risk using all reasonable and supportable information that is available without undue cost or effort. In making that evaluation, the Group reassesses indicators of changes in credit quality of their counterparties. In addition, the Group considers that there has been a significant increase in credit risk when contractual payments are more than 90 days past due or if sufficient indicators exist that the debtor is unlikely to pay. Refer to note 10 and 11 for the respective notes on these items. Generally, trade receivables are written off when there is no reasonable expectation of recovery. Indicators of this include the failure of a debtor to engage in a repayment plan, no active enforcement activity and a failure to make contractual payments for a period greater than 1 year.
Management also monitors whether there has been a significant increase in credit risk of LFAs relative to initial recognition. This assessment is performed through ongoing review of case progression, achievement of key milestones, counterparty performance, and enforceability of settlements or awards. Where significant increases in credit risk are identified, these are reflected in the fair value measurement through reductions in expected cash flows or, where recovery is no longer expected, a full write-off of the asset. As at the reporting date, no significant increases in credit risk beyond those already incorporated into the fair value measurement have been identified.
Liquidity risk
Vigilant liquidity risk management requires the Group to maintain sufficient liquid assets (mainly cash and cash equivalents) to be able to pay debts as and when they become due and payable.
The Group manages liquidity risk by maintaining adequate cash reserves and by continuously monitoring actual and forecast cash flows and matching the maturity profiles of financial assets and liabilities.
Remaining contractual maturities
The maturity profile of the Group's financial liabilities based on contractual maturity on an undiscounted basis are:
|
|
Less than 1 year |
Between 1 and 5 years |
Over 5 years |
No contractual maturity date |
Total |
|
Consolidated - 2025 |
$'000 |
$'000 |
$'000 |
$'000 |
$'000 |
|
|
|
|
|
|
|
|
Financial liabilities |
|
|
|
|
|
|
Trade payables |
10,221 |
- |
- |
- |
10,221 |
|
Other payables |
286 |
- |
- |
- |
286 |
|
Borrowings |
8,396 |
97,381 |
- |
- |
105,777 |
|
Third-party interest in consolidated entities |
- |
- |
- |
226,538 |
226,538 |
|
Total non-derivatives |
18,903 |
97,381 |
- |
226,538 |
342,822 |
|
|
|
|
|
|
|
|
|
|
|
|||
|
|
Less than 1 year |
Between 1 and 5 years |
Over 5 years |
No contractual maturity date |
Total |
|
Consolidated - 2024 |
$'000 |
$'000 |
$'000 |
$'000 |
$'000 |
|
|
|
|
|
|
|
|
Financial liabilities |
|
|
|
|
|
|
Trade payables |
29,752 |
- |
- |
- |
29,752 |
|
Other payables |
624 |
- |
- |
- |
624 |
|
Borrowings |
68,200 |
- |
|
- |
68,200 |
|
Third-party interest in consolidated entities |
- |
- |
- |
264,950 |
264,950 |
|
Total non-derivatives |
98,576 |
- |
- |
264,950 |
363,526 |
Note 21. Fair value measurements
The fair value measurements used for all assets and liabilities held by the Group listed below are level 3:
|
Assets |
2025 |
2024 |
|
Litigation funding assets |
$'000 |
$'000 |
|
APAC |
81,220 |
111,662 |
|
EMEA |
206,515 |
353,551 |
|
Total Level 3 assets |
287,735 |
465,213 |
|
|
|
|
|
Liabilities |
|
|
|
Financial liabilities related to third-party interests in consolidated entities |
226,538 |
264,950 |
|
Total Level 3 liabilities |
226,538 |
264,950 |
Refer note 13 for movements in level 3 assets and note 16 for movements in level 3 liabilities. There were no transfers into or out of level 3 during the period ended 30 June 2025.
As at 30 June 2025, the financial liability due to third-party interests is $226,538,000 (2024: $264,950,000), recorded at fair value as represented in note 16. Amounts included in the consolidated statement of financial position represent the fair value of the third-party interests in the related financial assets and the amounts included in the consolidated statement of profit or loss and other comprehensive income represent the third-party share of any gain or loss during the period, see note 4.
Sensitivity of Level 3 Valuations
The Group's fair value policy provides for ranges of percentages to be applied against the risk adjustment factor to more than 159 discrete objective litigation events. The tables below set forth each of the key unobservable inputs used to value the Group's LFA assets and the applicable ranges and weighted average by relative fair value for such inputs.
The Group implemented a new valuation methodology for LFA assets during the year ended 30 June 2023. LFA assets are fair valued using an income approach which is the technique adopted for LFA Assets. Under the income approach, future cash flows associated with; cash out flows, including investments and deployments, and cash inflows such as settlements or resolutions, are converted to a single current (discounted) amount, reflecting current market expectations about those future amounts. That is, the amount that could reasonably be expected to be paid to acquire the asset at that point in time. In developing our framework we also looked to Industry peers for alignment in methodology, the benefit being that adopting a similar methodology provides a level of comparability. Similar to industry peers, the framework developed applied probabilities based on observable milestones for each investment within the portfolio as well as making informed assumptions around inputs such as discount rates, timing and risk factors, all of which are considered Level 3 inputs. In cases where cash flows are denominated in a foreign currency, forecasts are developed in the applicable foreign currency and translated to AUD dollars.
A Discounted Cash Flow approach is then applied to each underlying investment on an individual basis to arrive at a net present value of the future expected cash flows.
The cash flow forecast is updated each reporting period, based on the best available information on progress of the underlying matter at the time. These objective events could include, among others:
|
- |
Stage of the investment |
|
- |
ongoing developments |
|
- |
progress |
|
- |
recovery or sovereign risk |
|
- |
legal team expertise |
|
- |
other factors impacting the expected outcome |
Each reporting period, the updated risk-adjusted cash flow forecast is then discounted at the then current discount rate to measure fair value. The discount rate includes an applicable risk-free rate and credit spread to incorporate both market and idiosyncratic asset-class risk.
The Group's fair value policy provides for ranges of percentages to be applied against the risk adjustment factor to more than 159 discrete objective litigation events. The tables below set forth each of the key unobservable inputs used to value the Group's LFA assets and the applicable ranges and weighted average by relative fair value for such inputs.
30 June 2025
|
Item |
Valuation technique |
Unobservable Input1 |
Min |
Max |
|
Weighted average |
|
|
Litigation funding asset |
Discounted cash flow |
Discount rate |
10.2% |
10.9% |
|
10.6% |
|
|
|
|
Duration (years) |
2.42 |
7.67 |
|
5.45 |
|
|
|
|
Adjusted risk premium |
(60%) |
80% |
|
10% |
|
|
|
|
|
|
|
|
|
|
|
|
|
Adjusted risk premium - case milestone |
Min2 |
Max2 |
|
Weighted average |
% of portfolio3 |
|
|
|
Pre-commencement & commenced |
0% |
0% |
|
0% |
56% |
|
|
|
Pleadings |
0% |
10% |
|
2% |
9% |
|
|
|
Discovery & evidence |
10% |
20% |
|
15% |
10% |
|
|
|
Significant ruling or other objective event prior to trial court judgment |
20% |
65% |
|
64% |
6% |
|
|
|
Settlement |
90% |
90% |
|
0% |
0% |
|
|
|
Trial court judgment or tribunal award |
(100%) |
75% |
|
(22%) |
8% |
|
|
|
Appeal judgment |
(100%) |
80% |
|
(46%) |
8% |
|
|
|
Enforcement |
80% |
80% |
|
80% |
3% |
|
|
|
|
|
|
|
|
|
30 June 2024
|
Item |
Valuation technique |
Unobservable Input1 |
Min |
Max |
|
Weighted average |
|
|
Litigation funding asset |
Discounted cash flow |
Discount rate |
12.8% |
12.8% |
|
12.8% |
|
|
|
|
Duration (years) |
0.75 |
7.08 |
|
4.57 |
|
|
|
|
Adjusted risk premium |
0% |
85% |
|
17% |
|
|
|
|
|
|
|
|
|
|
|
|
|
Adjusted risk premium - case milestone |
Min2 |
Max2 |
|
Weighted average |
% of portfolio3 |
|
|
|
Pre-commencement & commenced |
0% |
20% |
|
29% |
48% |
|
|
|
Pleadings |
5% |
35% |
|
20% |
12% |
|
|
|
Discovery & evidence |
20% |
40% |
|
25% |
9% |
|
|
|
Significant ruling or other objective event prior to trial court judgment |
25% |
80% |
|
47% |
7% |
|
|
|
Settlement |
70% |
85% |
|
80% |
1% |
|
|
|
Trial court judgment or tribunal award |
0% |
85% |
|
63% |
9% |
|
|
|
Appeal judgment |
0% |
85% |
|
3% |
12% |
|
|
|
Enforcement |
75% |
85% |
|
83% |
3% |
|
|
|
|
|
|
|
|
|
1 Refer note 3 for refinements made to the valuation methodology during the period
2 Minimum and maximum within each cohort represent the actual adjusted risk premiums applied in the period
3 Percentage of portfolio represents the percentage of the book within the cohort
At each reporting period, the Group reviews the fair value of each litigation funding asset in connection with the preparation of the consolidated financial statements. A fair value of 10% higher or lower, while all other variables remain constant, in financial assets at fair value through profit or loss would have increased or decreased the Group's income and net assets by $28,774,000 as at 30 June 2025 (30 June 2024: $46,521,000). Similarly, a fair value of 10% higher or lower, while all other variables remain constant, in financial liabilities at fair value through profit or loss would have increased or decreased the Group's income and net assets by $22,654,000 as at 30 June 2025 (30 June 2024: $26,495,000).
At 30 June 2025, should discount rates been 50 bps or 100 bps higher or lower than the actual discount rate used in the fair value estimation, while all other variables remained constant, consolidated income and net assets would have increased and decreased by the following amounts:
|
|
2025 |
2024 |
|
Hypothetical Change |
$'000 |
$'000 |
|
100bps lower interest rates |
519 |
5,441 |
|
50bps lower interest rates |
257 |
2,743 |
|
100bps higher interest rates |
(502) |
(5,440) |
|
50bps higher interest rates |
(253) |
(2,736) |
Reasonably possible alternative assumptions
The determination of fair value for litigation funding assets involves significant judgements and estimates. While the potential range of outcomes for the assets is wide, the Group's fair value estimation is its best assessment of the current fair value of each asset, as applicable. Such estimate is inherently subjective, being based largely on an assessment of how individual events have changed the possible outcomes of the asset, as applicable, and their relative probabilities and hence the extent to which the fair value has altered. The aggregate of the fair values selected falls within a wide range of reasonably possible estimates. In the Group's opinion, there is no useful alternative valuation that would better quantify the market risk inherent in the portfolio and there are no inputs or variables to which the values of the assets are correlated other than interest rates which impact the discount rates applied.
Note 22. Key management personnel disclosures
Compensation
The aggregate compensation made to Directors and other members of key management personnel of the Group is set out below:
|
|
Consolidated |
|
|
|
2025 |
2024 |
|
|
$ |
$ |
|
|
|
|
|
Short-term employee benefits |
2,918,408 |
2,844,106 |
|
Post-employment benefits |
54,934 |
67,584 |
|
Long-term benefits |
12,291 |
28,975 |
|
Share-based payments |
402,653 |
408,583 |
|
|
3,388,286 |
3,349,249 |
Details of the remuneration of key management personnel of the Group are set out in the following tables.
|
|
Cash salaries and fees |
Bonus |
Benefits |
Accrued leave |
Superannua- tion/ |
Long service leave |
Share-based payments |
Total |
|
2025 |
$ |
$ |
$ |
$ |
$ |
$ |
$ |
$ |
|
Non-executive Directors |
|
|
|
|
|
|
|
|
|
Dr David King |
115,594 |
- |
- |
- |
13,293 |
- |
- |
128,887 |
|
Jonathan Moulds |
230,576 |
- |
- |
- |
- |
- |
- |
230,576 |
|
Gerhard Seebacher1 |
70,492 |
- |
- |
- |
- |
- |
- |
70,492 |
|
|
416,661 |
- |
- |
- |
13,293 |
- |
- |
429,954 |
|
|
|
|
|
|
|
|
|
|
|
Executive directors & other executives |
||||||||
|
Patrick Moloney |
1,209,885 |
117,295 |
156,954 |
56,298 |
13,393 |
12,291 |
402,653 |
1,968,768 |
|
David Collins2 |
698,580 |
- |
188 |
- |
1,994 |
- |
- |
700,762 |
|
Mary Gangemi3 |
262,547 |
- |
- |
- |
26,255 |
- |
- |
288,802 |
|
|
2,171,012 |
117,295 |
157,143 |
56,298 |
41,641 |
12,291 |
402,653 |
2,958,332 |
|
|
2,587,673 |
117,295 |
156,954 |
56,298 |
54,934 |
12,291 |
402,653 |
3,388,286 |
1 Resigned as Director 15 January 2025
2 Appointed as Director 29 November 2024
3 Resigned as Director 5 September 2024. The amounts disclosed for Ms Gangemi represent payments made in connection with her cessation of employment, including notice period entitlements, and are classified as termination benefits.
|
|
Cash salaries and fees |
Bonus |
Benefits |
Accrued leave |
Superannua-tion/ |
Long service leave |
Share-based payments |
Total |
|
2024 |
$ |
$ |
$ |
$ |
$ |
$ |
$ |
$ |
|
Non-executive Directors |
|
|
|
|
|
|
|
|
|
Dr David King |
111,458 |
- |
- |
- |
12,302 |
- |
- |
123,760 |
|
Jonathan Moulds |
214,255 |
- |
- |
- |
- |
- |
- |
214,255 |
|
Gerhard Seebacher |
127,377 |
- |
- |
- |
- |
- |
- |
127,377 |
|
|
453,091 |
- |
- |
- |
12,302 |
- |
- |
465,393 |
|
|
|
|
|
|
|
|
|
|
|
Executive directors & other executives |
||||||||
|
Patrick Moloney |
1,316,062 |
183,783 |
114,754 |
36,864 |
- |
28,975 |
199,145 |
1,879,583 |
|
David Collins1 |
22,921 |
- |
- |
- |
- |
- |
- |
22,921 |
|
Mary Gangemi2 |
552,818 |
163,814 |
- |
- |
55,282 |
- |
209,438 |
981,352 |
|
|
1,891,800 |
347,597 |
114,754 |
36,864 |
55,282 |
28,975 |
408,583 |
2,883,856 |
|
|
2,344,891 |
347,597 |
114,754 |
36,864 |
67,584 |
28,975 |
408,583 |
3,349,249 |
1 David Collins appointed as Chief Financial Officer on 18 June 2024 on a base salary of £350,000 (AUD equivalent $672,000). Refer note 25 for details on amounts paid to Greatham Advisors Limited, a related entity of David Collins, for Investor Relation services prior to David becoming an employee. David Collins has not been appointed as a Director as at 30 June 2024.
2 Stepped down as Chief Financial Officer 18 June 2024 and resigned as Director 5 September 2024
Directors' share options
The details of options over ordinary shares in the Company held during the financial year by each Director is set out below:
|
Name of the Director |
Grant date |
Expiry date |
Exercise price |
Balance at the start of the year |
Granted |
Exercised |
Expired/ forfeited/ other |
Balance at the end of the year |
|
Patrick Moloney |
19/11/2018 |
25/11/2028 |
$0.47 |
1,595,058 |
- |
- |
- |
1,595,058 |
|
Patrick Moloney |
04/12/2017 |
04/12/2027 |
$0.60 |
1,000,000 |
- |
- |
- |
1,000,000 |
|
Patrick Moloney |
04/12/2017 |
04/12/2027 |
$0.60 |
1,000,000 |
- |
- |
- |
1,000,000 |
|
Patrick Moloney |
01/11/2019 |
01/11/2029 |
£0.7394 |
777,600 |
- |
- |
- |
777,600 |
|
Patrick Moloney |
13/10/2020 |
13/10/2030 |
£0.6655 |
291,597 |
- |
- |
- |
291,597 |
|
Patrick Moloney |
27/10/2021 |
27/10/2031 |
£1.06 |
279,232 |
- |
- |
- |
279,232 |
|
Patrick Moloney1 |
27/10/2021 |
27/10/2031 |
£1.06 |
900,000 |
- |
- |
- |
900,000 |
|
Mary Gangemi2 |
27/10/2021 |
27/10/2031 |
£1.06 |
93,585 |
- |
- |
- |
93,585 |
|
Mary Gangemi2 |
27/10/2021 |
27/10/2031 |
£1.14 |
26,315 |
- |
- |
- |
26,315 |
|
Patrick Moloney |
07/10/2022 |
07/10/2032 |
- |
169,276 |
- |
(112,850) |
- |
56,426 |
|
Patrick Moloney |
07/10/2022 |
07/10/2032 |
- |
3,303,796 |
- |
- |
- |
3,303,796 |
|
Mary Gangemi2 |
07/10/2022 |
07/10/2032 |
- |
134,217 |
- |
- |
- |
134,217 |
|
Mary Gangemi2 |
07/10/2022 |
07/10/2032 |
- |
1,266,455 |
- |
- |
- |
1,266,455 |
|
Patrick Moloney |
04/10/2023 |
04/10/2033 |
- |
167,043 |
- |
(55,681) |
- |
111,362 |
|
Mary Gangemi2 |
04/10/2023 |
04/10/2033 |
- |
148,893 |
- |
- |
- |
148,893 |
|
Patrick Moloney |
04/10/2024 |
04/10/2034 |
- |
- |
122,302 |
- |
- |
122,302 |
|
|
|
|
|
11,153,067 |
122,302 |
(168,531) |
- |
11,106,838 |
1 On 27 October 2021, Patrick Moloney exercised 900,000 unlisted options at an exercise price of A$1.00 which were granted under the Employee share option scheme. Upon exercise, the Group issued 900,000 new ordinary shares in the capital of the Group to Patrick Moloney which have been granted under the Loan Share Plan with the sole purpose to fund the exercise price of the 900,000 unlisted options
2 Outstanding share options as disclosed in Note 28.
3 Resigned as Director 5 September 2024
Directors' interests
The number of shares in the Company held at the end of the financial year by each Director is set out below:
|
Name of the Director |
Description of shares |
30 June 2025 Number |
30 June 2024 Number |
|
Jonathan Moulds |
Fully paid ordinary shares |
5,250,000 |
5,250,000 |
|
Dr David King |
Fully paid ordinary shares |
1,951,484 |
1,951,484 |
|
Patrick Moloney |
Fully paid ordinary shares |
4,312,353 |
4,219,813 |
|
Patrick Moloney |
Unlisted partly paid shares1 |
1,433,022 |
1,433,022 |
|
David Collins |
N/A |
- |
- |
|
Mary Gangemi |
Fully paid ordinary shares |
- |
64,348 |
|
Gerhard Seebacher |
N/A |
- |
- |
1 The 30 June 2024 comparative disclosure has been corrected in the current year to reflect the accurate number of shares, being an increase of 15,000 shares. This change relates only to disclosure and does not affect the total issued share capital of the Group.
2 Unlisted partly paid shares in the Company were issued at a price of $0.17 per share, wholly unpaid and will convert to a share upon payment to the Company of $0.17 per share. Further details provided in Note 17 to the financial statements.
No changes took place in the interest of the directors between 30 June 2025 and 1 October 2025.
Note 23. Remuneration of auditors
During the financial year the following fees were paid or payable for services provided by BDO Audit Pty Ltd, the auditor of the Company, and its network firms:
|
|
Consolidated |
|
|
|
2025 |
2024 |
|
|
$ |
$ |
|
Audit Services - BDO Audit Pty Ltd |
|
|
|
Audit or review of financial report |
186,560 |
253,727 |
|
|
186,560 |
253,727 |
|
|
|
|
|
Audit Services - Firms related to BDO Audit Pty Ltd |
|
|
|
Audit of statutory report of controlled entities |
182,626 |
186,721 |
|
|
182,626 |
186,721 |
|
|
|
|
|
Audit Services - Unrelated Firms |
|
|
|
Audit of statutory report of controlled entities |
75,668 |
64,625 |
|
|
75,668 |
64,625 |
Note 24. Contingent liabilities
The majority of the Group's funding agreements contain a contractual indemnity from the Group to the funded party that the Group will pay adverse costs awarded to the successful party in respect of costs incurred during the period of funding, should the client's litigation be unsuccessful. The Group's position is that for the majority of litigation projects which are subject to funding, the Group enters into insurance arrangements which lessen or eliminate the impact of such awards and therefore any adverse costs order exposure.
Note 25. Related party transactions
The following transactions occurred with related parties:
|
|
Consolidated |
|
|
|
2025 |
2024 |
|
|
$ |
$ |
|
|
|
|
|
Consulting fees paid to Greatham Advisors Limited - a related entity of David Collins |
- |
47,957 |
|
|
- |
47,957 |
David Collins is a shareholder and director of Greatham Advisors Limited, which carries out Investor Relations services. The services provided by Greatham Advisors Limited ceased once David Collins became an employee of the Group on 18 June 2024. As at 30 June 2025 there were no amounts owing to Greatham Advisors Limited (2024: $nil).
Note 26. Parent entity information
Set out below is the supplementary information about the parent entity, Litigation Capital Management Limited.
|
|
|
|
|||
|
Statement of profit or loss and other comprehensive income |
Consolidated |
|
|||
|
|
2025 |
2024 |
|
||
|
|
$'000 |
$'000 |
|
||
|
Profit/(loss) after income tax |
10,792 |
50,491 |
|
||
|
Total comprehensive income |
10,792 |
50,491 |
|
||
|
|
|
|
|
||
|
Statement of financial position |
|
|
|
||
|
|
|
|
|
||
|
Total assets |
99,710 |
103,055 |
|
||
|
Total liabilities |
(10,114) |
(20,390) |
|
||
|
|
|
|
|
||
|
Equity |
|
|
|
||
|
Issued capital |
60,634 |
64,278 |
|
||
|
Share based payments reserve |
3,095 |
3,556 |
|
||
|
Retained earnings |
25,868 |
14,831 |
|
||
|
Total equity |
89,596 |
82,665 |
|
||
Guarantees entered into by the parent entity in relation to the debts of its subsidiaries
Litigation Capital Management Limited (as holding entity), LCM Operations Pty Ltd, LCM Litigation Fund Pty Ltd, LCM Corporate Services Pty Ltd, LCM Recoveries Pty Ltd, LCM Funding Pty Ltd, LCM Singapore Pty Ltd, LCM Funding SG Pty Ltd and LCM Group Holdings Pty Ltd are parties to a deed of cross guarantee under which each company guarantees the debts of the others. The specified subsidiaries represent a 'closed group' for the purposes of the guarantee, and as there are no other parties to the Deed that are controlled by the Group, they also represent the 'extended closed group'.
Contingent liabilities
The parent entity had no contingent liabilities as at 30 June 2025 and 30 June 2024.
Capital commitments - Property, plant and equipment
The parent entity had no capital commitments for property, plant and equipment as at 30 June 2025 and 30 June 2024.
Material accounting policies
The accounting policies of the parent entity are consistent with those of the Group, as disclosed in note 2, except for the following:
|
· |
Investments in subsidiaries are accounted for at cost, less any impairment, in the parent entity. |
|
· |
Dividends received from subsidiaries are recognised as other income by the parent entity and its receipt may be an indicator of an impairment of the investment. |
Note 27. Interests in subsidiaries
The consolidated financial statements incorporate the assets, liabilities and results of the following subsidiaries in accordance with the accounting policy described in note 2:
|
|
Principal place of business / Country of incorporation |
Ownership Interest |
||||
|
|
2025 |
2024 |
|
|||
|
Name |
% |
% |
|
|||
|
LCM Litigation Fund Pty Ltd |
Australia |
100% |
100% |
|
||
|
LCM Operations Pty Ltd |
Australia |
100% |
100% |
|
||
|
LCM Corporate Services Pty Ltd |
Australia |
100% |
100% |
|
||
|
LCM Singapore Pty Ltd |
Australia |
100% |
100% |
|
||
|
LCM Recoveries Pty Ltd |
Australia |
100% |
100% |
|
||
|
LCM Advisory Limited |
Australia |
100% |
100% |
|
||
|
LCM Funding Pty Ltd |
Australia |
100% |
100% |
|
||
|
LCM Funding SG Pty Ltd |
Australia |
100% |
100% |
|
||
|
LCM Corporate Services Pte. Ltd. |
Singapore |
100% |
100% |
|
||
|
LCM Operations UK Limited |
United Kingdom |
100% |
100% |
|
||
|
LCM Corporate Services UK Limited |
United Kingdom |
100% |
100% |
|
||
|
LCM Recoveries UK Limited |
United Kingdom |
100% |
100% |
|
||
|
LCM Funding UK Limited |
United Kingdom |
100% |
100% |
|
||
|
LCM Group Holdings Pty Ltd |
Australia |
100% |
100% |
|
||
|
ASG Ghana Limited |
Ghana |
100% |
N/A |
|
||
|
|
|
|
|
|
||
|
LCM Global Alternative Returns Fund |
|
|
|
|||
|
LCM Global Alternative Returns Fund GP Limited |
Jersey |
100% |
100% |
|
||
|
LCM Global Alternative Returns Fund (Special Partner) LP |
Jersey |
100% |
100% |
|
||
|
|
|
|
|
|
||
|
LCM Global Alternative Returns Fund II |
|
|
|
|||
|
LCM Global Alternative Returns Fund II GP Limited |
Jersey |
100% |
100% |
|
||
|
LCM Global Alternative Returns Fund II (Special Partner) LP |
Jersey |
100% |
100% |
|
||
Note 28. Share-based payments
The share-based payment expense for the period was $1,212,000 (2024: $1,116,000).
Loan Funded Share Plans ('LSP')
As detailed in note 17, the Group has an equity scheme pursuant to which certain employees may access a LSP. The shares under LSP are issued at the exercise price by granting a limited recourse loan. The LSP shares are restricted until the loan is repaid. Options under this scheme can be granted without an underlying LSP share until they have been exercised and on this basis, do not form part of the Group's issued share capital. The underlying options have been accounted for as a share-based payments. The options are issued over a 1-3 year vesting period. Vesting conditions include satisfaction of customary continuous employment with the Group and may include a share price hurdle.
During the period the Group granted nil (2024: nil) shares under the LSP.
Set out below are summaries of shares/options granted under the LSP:
|
2025 |
|
|
|
|
|
|
|
|
|
|
|
Grant date |
Expiry date |
Exercise |
Balance at the start of the period |
Granted |
Exercised |
Expired/ |
Balance at the end of the period |
|
||
|
04/12/2017 |
04/12/2027 |
$0.60 |
2,000,000 |
- |
- |
- |
2,000,000 |
|
||
|
31/08/2018 |
31/08/2028 |
$0.77 |
411,972 |
- |
(411,972) |
- |
- |
|
||
|
19/11/2018 |
25/11/2028 |
$0.47 |
1,595,058 |
- |
- |
- |
1,595,058 |
|
||
|
03/12/2018 |
03/12/2028 |
$0.89 |
100,000 |
- |
- |
- |
100,000 |
|
||
|
01/11/2019 |
01/11/2029 |
£0.7394 |
1,043,953 |
- |
(125,259) |
- |
918,694 |
|
||
|
13/10/2020 |
13/10/2030 |
£0.6655 |
616,520 |
- |
(158,296) |
- |
458,224 |
|
||
|
27/10/2021 |
27/10/2031 |
£1.06 |
1,512,638 |
- |
(163,209) |
- |
1,349,429 |
|
||
|
27/10/2021 |
27/10/2031 |
£1.06 |
99,037 |
- |
- |
- |
99,0371 |
|
||
|
27/10/2021 |
27/10/2031 |
£1.14 |
122,430 |
- |
- |
- |
122,4301 |
|
||
|
|
|
|
7,501,608 |
- |
(858,736) |
- |
6,642,872 |
|
||
|
|
|
|
|
|
|
|
|
|
||
|
1Options granted without an underlying LSP share until exercised ie, do not form part of the Group's issued share capital |
|
|||||||||
|
Weighted average exercise price |
$1.089 |
$0.000 |
$1.240 |
$0.000 |
$1.113 |
|
||||
|
|
|
|
|
|
|
|
|
|
||
|
|
|
|
|
|
|
|
|
|
||
|
2024 |
|
|
|
|
|
|
|
|
||
|
Grant date |
Expiry date |
Exercise |
Balance at the start of the period |
Granted |
Exercised |
Expired/ |
Balance at the end of the period |
|
||
|
04/12/2017 |
04/12/2027 |
$0.60 |
2,000,000 |
- |
- |
- |
2,000,000 |
|
||
|
31/08/2018 |
31/08/2028 |
$0.77 |
411,972 |
- |
- |
- |
411,972 |
|
||
|
19/11/2018 |
25/11/2028 |
$0.47 |
1,595,058 |
- |
- |
- |
1,595,058 |
|
||
|
03/12/2018 |
03/12/2028 |
$0.89 |
100,000 |
- |
- |
- |
100,000 |
|
||
|
01/11/2019 |
01/11/2029 |
£0.7394 |
1,432,753 |
- |
- |
(388,800) |
1,043,953 |
|
||
|
13/10/2020 |
13/10/2030 |
£0.6655 |
616,520 |
- |
- |
- |
616,520 |
|
||
|
27/10/2021 |
27/10/2031 |
£1.06 |
1,512,638 |
- |
- |
- |
1,512,638 |
|
||
|
27/10/2021 |
27/10/2031 |
£1.06 |
99,037 |
- |
- |
- |
99,0371 |
|
||
|
27/10/2021 |
27/10/2031 |
£1.14 |
122,430 |
- |
- |
- |
122,4301 |
|
||
|
|
|
|
7,890,408 |
- |
- |
(388,800) |
7,501,608 |
|
||
|
|
|
|
|
|
|
|
|
|
||
|
Weighted average exercise price |
$1.049 |
$0.000 |
$0.000 |
$1.420 |
$1.089 |
|
||||
|
|
|
|
|
|
|
|
|
|
|
|
|
1Options granted without an underlying LSP share until exercised ie, do not form part of the Group's issued share capital |
|
|||||||||
There were 6,642,872 options vested and exercisable as at 30 June 2025 (2024: 7,501,608).
The weighted average remaining contractual life of options under LSP outstanding at the end of the financial year was 0.759 years (2024: 0.892 years).
Deferred Bonus Share Plan ('DBSP')
The Company has in place a DBSP. Options granted under the DBSP reflect past performance and are in the form of nil cost options and will vest in three equal tranches from the date of issue and are subject to continued employment over the three year period.
In addition, the Options granted under the DBSP are subject to malus and clawback provisions. In the event of a change of control of the Company, unvested awards will vest to the extent determined by the Board, taking into account the proportion of the period of time between grant and the normal vesting date that has elapsed at the date of the relevant event.
During the period the Group granted 532,235 (2024: 771,911) options under the DBSP.
Set out below are summaries of options granted under the DBSP:
|
2025 |
|
|
|
|
|
|
|
|
Grant date |
Expiry date |
Exercise |
Balance at the start of the period |
Granted |
Exercised |
Expired/ |
Balance at the end of the period |
|
07/10/2022 |
07/10/2032 |
$0.00 |
877,435 |
- |
(442,468) |
- |
434,967 |
|
04/10/2023 |
04/10/2033 |
$0.00 |
771,911 |
- |
(224,079) |
- |
547,832 |
|
04/10/2024 |
04/10/2034 |
$0.00 |
- |
532,235 |
- |
- |
532,235 |
|
|
|
|
1,649,346 |
532,235 |
(666,547) |
- |
1,515,034 |
|
|
|
|
|
|
|
|
|
|
Weighted average exercise price |
$0.000 |
$0.000 |
$0.000 |
$0.000 |
$0.000 |
||
|
|
|
|
|
|
|
|
|
|
2024 |
|
|
|
|
|
|
|
|
Grant date |
Expiry date |
Exercise |
Balance at the start of the period |
Granted |
Exercised |
Expired/ |
Balance at the end of the period |
|
07/10/2022 |
07/10/2032 |
$0.00 |
1,132,692 |
- |
(255,257) |
- |
877,435 |
|
04/10/2023 |
04/10/2033 |
$0.00 |
- |
771,911 |
- |
- |
771,911 |
|
|
|
|
1,132,692 |
771,911 |
(255,257) |
- |
1,649,346 |
|
|
|
|
|
|
|
|
|
|
Weighted average exercise price |
$0.000 |
$0.000 |
$0.000 |
$0.000 |
$0.000 |
||
There were 634,868 options vested (2024: 377,564) and 666,547 exercised (average share price $2.054) as at 30 June 2025 (2024: 255,257. Average share price $1.956).
The weighted average remaining contractual life of options under DBSP outstanding at the end of the financial year was 0.817 years (2024: 0.814 years).
Executive Long Term Incentive Plan ('LTIP')
The Company has in place an Executive LTIP. Options over ordinary shares in the capital of the Company ("Ordinary Shares") are issued to recipients under the LTIP plan. The options set out above have been granted under the LTIP in the form of nil cost options and are subject to performance conditions which require the growth of Funds under Management ('FuM') over a five year performance period. The performance conditions associated with the options are set out below:
(1) 50% vesting on reaching a minimum of FuM of US$750m; and
(2) 100% vesting on reaching FuM of US$1bn.
The vesting date of options granted is the later of:
(1) the third anniversary of the Grant Date;
(2) the satisfaction of the Performance Condition; or
(3) the date of any adjustment under the Plan rules of the Plan at the Boards discretion.
Any awards made to the participants are subject to a five year holding period from the grant date. In the event of a change of control of the Company, unvested awards will vest to the extent determined by the Board, taking into account the proportion of the period of time between grant and the normal vesting date that has elapsed at the date of the relevant event and the extent to which any performance condition has been satisfied at the date of the relevant event.
During the period the Group granted nil (2024: nil) options under the LTIP.
Set out below are summaries of shares/options granted under the LTIP:
|
2025 |
|
|
|
|
|
|
|
|
Grant date |
Expiry date |
Exercise |
Balance at the start of the period |
Granted |
Exercised |
Expired/ |
Balance at the end of the period |
|
07/10/2022 |
07/10/2032 |
$0.0000 |
5,671,516 |
- |
- |
- |
5,671,516 |
|
|
|
|
5,671,516 |
- |
- |
- |
5,671,516 |
|
|
|
|
|
|
|
|
|
|
Weighted average exercise price |
$0.000 |
$0.000 |
$0.000 |
$0.000 |
$0.000 |
||
|
|
|
|
|
|
|
|
|
|
2024 |
|
|
|
|
|
|
|
|
Grant date |
Expiry date |
Exercise |
Balance at the start of the period |
Granted |
Exercised |
Expired/ |
Balance at the end of the period |
|
07/10/2022 |
07/10/2032 |
$0.0000 |
5,671,516 |
- |
- |
- |
5,671,516 |
|
|
|
|
5,671,516 |
- |
- |
- |
5,671,516 |
|
|
|
|
|
|
|
|
|
|
Weighted average exercise price |
$0.000 |
$0.000 |
$0.000 |
$0.000 |
$0.000 |
||
There were nil LTIP's vested and exercisable as at 30 June 2025 (2024: nil).
The weighted average remaining contractual life of options under DBSP outstanding at the end of the financial year was 0.263 years (2024: 1.263 years).
For the options under LSP granted during the current period, the valuation model inputs used in the Black-Scholes pricing model to determine the fair value at the grant date, are as follows:
|
Grant date |
Expiry date |
Share price at grant date |
Exercise price |
Expected volatility |
Dividend yield |
Risk-free interest rate |
Fair value at grant date |
|
04/10/2024 |
04/10/2034 |
£0.98 |
£0.00 |
35.00% |
1.10% |
4.30% |
£0.9478 |
The expected volatility reflects the assumption that the historical volatility over a period similar to the life of the options is indicative of future trends, which may not necessarily be the actual outcome.
Note 29. Events after the reporting period
On 18 September 2025, the Group announced the termination of its investment in the class action brought on behalf of commercial fishermen against Gladstone Ports Corporation. The settlement, which is subject to Court approval in October 2025, provides for a full release of claims and a payment of a portion of Gladstone Ports Corporation's costs, which will be covered by After the Event Insurance.
The investment was carried at A$30.8 million, equal to the cash invested, and will now be written off. The Group is pursuing potential avenues for recovery, including a costs assessment and possible claims against the former solicitors involved in the matter.
Consolidated entity disclosure statement
For the year ended 30 June 2025
|
Name |
Type of entity |
Trustee, partner, or participant in joint venture |
% of share capital held |
Country of incorporation |
Australian resident or foreign resident (for tax purposes) |
Foreign tax jurisdiction of foreign residents |
|
|
|
|
|
|
|
|
|
Litigation Capital Management Limited |
Body corporate |
n/a |
n/a |
Australia |
Australia |
n/a |
|
LCM Litigation Fund Pty Ltd |
Body corporate |
n/a |
100% |
Australia |
Australia |
n/a |
|
LCM Operations Pty Ltd |
Body corporate |
n/a |
100% |
Australia |
Australia |
n/a |
|
LCM Corporate Services Pty Ltd |
Body corporate |
n/a |
100% |
Australia |
Australia |
n/a |
|
LCM Singapore Pty Ltd |
Body corporate |
n/a |
100% |
Australia |
Australia |
n/a |
|
LCM Recoveries Pty Ltd |
Body corporate |
n/a |
100% |
Australia |
Australia |
n/a |
|
LCM Advisory Limited |
Body corporate |
n/a |
100% |
Australia |
Australia |
n/a |
|
LCM Funding Pty Ltd |
Body corporate |
Trustee1 |
100% |
Australia |
Australia |
n/a |
|
LCM Funding SG Pty Ltd |
Body corporate |
Trustee1 |
100% |
Australia |
Australia |
n/a |
|
LCM Corporate Services Pte. Ltd. |
Body corporate |
n/a |
100% |
Singapore |
Australia |
n/a |
|
LCM Group Holdings Pty Ltd |
Body corporate |
n/a |
100% |
Australia |
Australia |
n/a |
|
LCM Operations UK Limited |
Body corporate |
n/a |
100% |
United Kingdom |
Foreign |
United Kingdom |
|
LCM Corporate Services UK Limited |
Body corporate |
n/a |
100% |
United Kingdom |
Foreign |
United Kingdom |
|
LCM Recoveries UK Limited |
Body corporate |
n/a |
100% |
United Kingdom |
Foreign |
United Kingdom |
|
LCM Funding UK Limited |
Body corporate |
Trustee1 |
100% |
United Kingdom |
Foreign |
United Kingdom |
|
ASG Ghana Limited |
Body corporate |
n/a |
100% |
Ghana |
Foreign |
United Kingdom |
|
LCM Global Alternative Returns Fund LP |
Partnership |
n/a |
n/a |
Jersey |
Foreign |
n/a2 |
|
LCM Global Alternative Returns Feeder Fund LP |
Partnership |
n/a |
n/a |
Jersey |
Foreign |
n/a2 |
|
LCM Global Alternative Returns Fund GP Limited |
Body corporate |
Partner |
100% |
Jersey |
Foreign |
Jersey |
|
LCM Global Alternative Returns Fund (Special Partner) LP |
Partnership |
Partner |
n/a |
Jersey |
Foreign |
Jersey |
|
LCM Global Alternative Returns Fund II LP |
Partnership |
n/a |
n/a |
Jersey |
Foreign |
n/a2 |
|
LCM Global Alternative Returns Feeder Fund II LP |
Partnership |
n/a |
n/a |
Jersey |
Foreign |
n/a2 |
|
LCM Global Alternative Returns Fund II Holding 1 LP |
Partnership |
n/a |
n/a |
Jersey |
Foreign |
n/a2 |
|
LCM Global Alternative Returns Fund II Holding 2 LP |
Partnership |
n/a |
n/a |
Jersey |
Foreign |
n/a2 |
|
LCM Global Alternative Returns Fund II GP Limited |
Body corporate |
Partner |
100% |
Jersey |
Foreign |
Jersey |
|
LCM Global Alternative Returns Fund II (Special Partner) LP |
Partnership |
Partner |
n/a |
Jersey |
Foreign |
Jersey |
1 A trustee relationship is established through a Nominee Agreement, where the entity (the nominee) and the relevant Fund agree that the nominee will hold the Fund's investment on its behalf.
2 Limited Partners in the Funds are tax transparent and, as a result, are not considered tax residents of any particular jurisdiction
Directors' Declaration
In the directors' opinion:
· the attached financial statements and notes comply with the Corporations Act 2001, Australian Accounting Standards and other mandatory professional reporting requirements;
· the attached financial statements and notes comply with International Financial Reporting Standards as issued by the International Accounting Standards Board as described in note 2 to the financial statements;
· the attached financial statements and notes give a true and fair view of the consolidated entity's financial position as at 30 June 2025 and of its performance for the period ended on that date;
· there are reasonable grounds to believe that the company will be able to pay its debts as and when they become due and payable; and
· the consolidated entity disclosure statement is true and correct.
Signed in accordance with a resolution of directors.
On behalf of the directors
Director
Dated this 1st day of October 2025
-end-
RNS may use your IP address to confirm compliance with the terms and conditions, to analyse how you engage with the information contained in this communication, and to share such analysis on an anonymised basis with others as part of our commercial services. For further information about how RNS and the London Stock Exchange use the personal data you provide us, please see our Privacy Policy.
