Pan American Announces Revised PEA for the La Colorada Skarn Project, Positions La Colorada as a Future Top-tier Silver Mine
(All amounts are in
This press release features multimedia. View the full release here: https://www.businesswire.com/news/home/20260324224365/en/
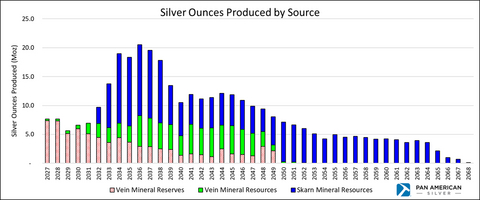
Expanded La Colorada Mine Production Profile. Notes: Includes assumed production from mineral resources, including inferred mineral resources. The Revised PEA for the
The Revised PEA includes a portion of the mineral resources from the
"The simultaneous development of newly identified high-grade veins at
Added
The Revised PEA for the
This news release contains forward-looking statements and information, and readers should refer to the Cautionary Note Regarding Forward-Looking Statements and Information at the end of this news release.
Expanded La Colorada Mine Key Production Metrics
|
KEY PRODUCTION METRICS (BY SOURCE) |
EXPANDED |
||
|
|
PROJECT2 |
||
|
Vein Mineral Reserves3 |
Vein Mineral Resources |
Skarn Mineral Resources |
|
|
Production period |
2027 - 2049 |
2027 - 2052 |
2032 - 2068 |
|
Production life - years |
23 |
26 |
37 |
|
Tonnes Processed (Life-of-mine ("LOM"))4 - Mt |
8.4 |
7.7 |
154.6 |
|
Annual silver production (initial 5 yr. avg.)4 - Moz |
3.3 |
4.0 |
11.8 |
|
Annual zinc production (initial 5 yr. avg.)4 - kt |
6.3 |
6.8 |
232.6 |
|
Annual lead production (initial 5 yr. avg.)4 - kt |
3.8 |
4.0 |
146.2 |
|
Total silver production (LOM) - Moz |
75.1 |
72.4 |
201.3 |
|
Total zinc production (LOM) - kt |
171.1 |
243.4 |
5,331.1 |
|
Total lead production (LOM) - kt |
93.4 |
122.3 |
2,420.0 |
|
Notes: |
||
|
|
1. |
All figures are rounded. |
|
|
2. |
Based on the Revised PEA. Mineral resources that are not mineral reserves do not have demonstrated economic viability. |
|
|
3. |
Mineral reserves do not include mineral resources. |
|
|
4. |
Average annual production over the initial 5-year period includes years 2034 to 2038 (the "Initial Five Year Period"), following the |
The existing
-
Large, long-life silver production: annual average silver production of 15.8 million ounces from the
La Colorada Skarn Project over the Initial Five Year Period, incremental to the anticipated average silver production of 3.3 million ounces from the existingLa Colorada mine mineral reserves during the same period. Total estimated mine life following completion of the construction of the new 15,000 tpd processing plant is 37 years. -
Low-cost production: average silver all-in sustaining costs ("AISC")(1) of negative
$22.67 per ounce over the Initial Five Year Period, reflecting the contribution of zinc and lead by-product credits. -
Attractive project returns: after-tax net present value ("NPV") (5%) of
$2.6 billion with an after-tax internal rate of return ("IRR") of 17% (the "Base Case Scenario"), which is incremental to the currentLa Colorada mine mineral reserve economics, and using long-term metal prices of$45.00 per ounce of silver,$2,800 per tonne of zinc and$2,000 per tonne of lead (the "Base Case Prices"). At increased prices of$75.00 per ounce of silver,$3,400 per tonne of zinc, and$2,000 per tonne of lead (the "Upside Price Scenario"), theLa Colorada Skarn Project after-tax NPV (5%) is$5.2 billion and the after-tax IRR is 25%. - Leveraged to silver revenue: at the Base Case Prices, the Initial Five Year Period revenue contribution is approximately 42% silver, 39% zinc and 19% lead, while at the Upside Price Scenario, the Initial Five Year Period revenue contribution is approximately 51% silver, 35% zinc and 14% lead.
-
Strong incremental free cash flow: average incremental annual free cash flow(1) of
$653 million over the Initial Five Year Period at the Base Case Prices, increasing to$988 million annually at the Upside Price Scenario, attributable to theLa Colorada Skarn Project and excluding any additional free cash flow generated by theLa Colorada mine mineral reserves. -
Funded growth: Pan American currently expects to fully fund the
La Colorada Skarn Project through cash flow generated by Pan American's operating mines, with spending to occur over 6 years and peak spending in the last 3 years while the processing plant is being constructed. The payback period of the initial investment of$1.9 billion on a standalone basis is 4 years using Base Case Prices and 3 years at the Upside Price Scenario. -
Improved grades: the
La Colorada Skarn Project grades under the Revised PEA are 84%, 45% and 54% higher for silver, zinc and lead, respectively, compared to the 2023 PEA(2) plan grades, driven by the shift from bulk caving to more selective long-hole open stope mining of high grade portions of the skarn deposit and the inclusion of additional high-grade mineralization from the vein mineral resources. -
De-risked development: The mining method to be employed is conventional long-hole open stoping with tailings paste backfill. A sub-level caving or block caving mining method is not envisioned in the Revised PEA, but potential opportunities remain to consider caving in a future expansion. No additional permitting is required for the 588 level ramp decline to provide initial access to the skarn deposit. Requests for permits will be submitted for other aspects of the
La Colorada Skarn Project , including mine shafts, a new processing plant and tailings facilities expansions. -
Significant potential for mineral resource expansion: exploration drilling continues to intersect mineralization outside of the current resource models, with more than 45,700 metres of recent skarn drilling and 48,000 metres of recent vein mine drilling not included in the current mineral resource estimate used for the Revised PEA. Please refer to Pan American's news release dated
March 5, 2026 for the most recent exploration drill results atLa Colorada . Ongoing exploration investments and geological potential suggest that mineral resources could continue to grow, possibly increasing and extending the mine's production. This may allow peak silver output to extend further. - Further optionality to extend mine life: an option exists for a future phase of mine expansion through adoption of a combination of block caving and sub-level caving mining methods over the coming decades to extract lower grade mineralization, particularly considering on-going exploration results (mineral resource expansion) or possible increased metal prices.
|
(1) Non-GAAP measure; please refer to the "Alternative Performance (non-GAAP) Measures" section of this news release for further information on these measures. |
|
(2) For details on the 2023 PEA, please refer to the NI 43-101 Technical Report for the |
An updated technical report prepared in accordance with NI 43-101 on the
The Revised PEA for the
The Revised PEA for the
CONFERENCE CALL AND WEBCAST
Pan American will host a conference call and webcast to discuss the
|
Date: |
|
|
|
Time: |
|
|
|
Webcast: |
https://event.choruscall.com/mediaframe/webcast.html?webcastid=JvlQ9YAf |
Participants can register for the conference at: https://dpregister.com
Upon registration, dial-in details will be displayed on screen and emailed as a calendar booking.
Those unable to register may join the call by dialing:
|
1-833-752-3507 |
(toll-free in |
|
| 1-647-846-7282 |
(International Participants) |
|
|
Web Phone |
https://hd.choruscall.com |
The live webcast and presentation slides will be available at https://panamericansilver.com/invest/financial-reports-and-filings/. An archive of the webcast will also be available for three months.
As development of the underground mine progresses, and as described in the Revised PEA, the construction of a new 15,000 tpd conventional selective flotation plant would be timed to match the expected initial production from the
The advantages of the development approach defined in the Revised PEA relative to the 2023 PEA, as described in the NI 43-101 Technical Report for the
The Revised PEA also concluded that, as exploration drilling continues to intersect additional mineralization outside of the current resource models, a long-term option exists for a future mine expansion considering a change of the mining methods to a combination of block caving and sub-level caving to include lower grade mineralization of the skarn deposit.
Expanded La Colorada Mine Production Profile
|
Period |
2027 - 2031 |
2032 - 2033 |
2034 |
2035 |
2036 |
2037 |
2038 |
2039 - 2052 |
2053 - 2068 |
Total LOM |
|||||||||
|
Tonnes Processed (Mt) |
|
|
|
|
|
|
|
|
|
|
|||||||||
|
|
3.1 |
1.0 |
0.5 |
0.5 |
0.3 |
0.3 |
0.2 |
2.4 |
— |
8.4 |
|||||||||
|
|
0.2 |
5.4 |
5.3 |
5.1 |
5.0 |
5.1 |
5.1 |
72.8 |
58.3 |
162.3 |
|||||||||
|
|
|
|
|
|
|
|
|
|
|
|
|||||||||
|
|
325.8 |
261.7 |
305.5 |
254.0 |
277.1 |
303.6 |
369.0 |
280.2 |
— |
298.0 |
|||||||||
|
|
477.5 |
96.7 |
93.2 |
96.8 |
117.5 |
108.7 |
100.7 |
57.7 |
34.4 |
58.5 |
|||||||||
|
Zinc Grade (%) |
|
|
|
|
|
|
|
|
|
|
|||||||||
|
|
2.39 |
2.51 |
1.63 |
1.90 |
1.78 |
2.28 |
1.56 |
2.34 |
— |
2.27 |
|||||||||
|
|
2.21 |
4.70 |
5.02 |
4.79 |
5.12 |
4.83 |
5.05 |
3.55 |
3.17 |
3.68 |
|||||||||
|
Lead Grade (%) |
|
|
|
|
|
|
|
|
|
|
|||||||||
|
|
1.30 |
1.47 |
1.19 |
1.25 |
1.13 |
1.21 |
0.88 |
1.17 |
— |
1.25 |
|||||||||
|
|
1.15 |
2.50 |
3.20 |
3.13 |
3.52 |
3.16 |
3.20 |
1.49 |
1.45 |
1.79 |
|||||||||
|
Silver Recovery (%) |
|
|
|
|
|
|
|
|
|
|
|||||||||
|
|
93.8 |
94.1 |
93.1 |
93.0 |
94.0 |
93.6 |
93.2 |
90.1 |
— |
92.8 |
|||||||||
|
|
93.8 |
92.3 |
92.0 |
92.3 |
93.4 |
93.0 |
92.5 |
89.2 |
86.0 |
89.7 |
|||||||||
|
Zinc Recovery (%) |
|
|
|
|
|
|
|
|
|
|
|||||||||
|
|
82.5 |
93.7 |
93.9 |
93.8 |
93.9 |
93.9 |
93.9 |
93.4 |
— |
89.2 |
|||||||||
|
|
82.5 |
93.9 |
94.0 |
93.9 |
94.0 |
93.9 |
94.0 |
93.4 |
93.1 |
93.4 |
|||||||||
|
Lead Recovery (%) |
|
|
|
|
|
|
|
|
|
|
|||||||||
|
|
88.6 |
88.4 |
90.0 |
89.9 |
90.5 |
90.0 |
90.1 |
86.3 |
— |
88.2 |
|||||||||
|
|
88.6 |
89.1 |
90.2 |
90.1 |
90.7 |
90.2 |
90.2 |
86.6 |
86.4 |
87.7 |
|||||||||
|
Silver Production (Moz) |
|
|
|
|
|
|
|
|
|
|
|||||||||
|
|
30.9 |
8.0 |
4.4 |
3.6 |
2.9 |
2.8 |
2.5 |
19.9 |
— |
75.1 |
|||||||||
|
|
3.5 |
15.4 |
14.6 |
14.7 |
17.6 |
16.7 |
15.3 |
120.4 |
55.4 |
273.7 |
|||||||||
|
Zinc Production (kt) |
|
|
|
|
|
|
|
|
|
|
|||||||||
|
|
62.1 |
23.9 |
7.4 |
8.5 |
5.8 |
6.7 |
3.3 |
53.4 |
— |
171.1 |
|||||||||
|
|
4.4 |
236.5 |
249.1 |
231.1 |
240.5 |
233.0 |
243.2 |
2,414.6 |
1,722.2 |
5,574.6 |
|||||||||
|
Lead Production (kt) |
|
|
|
|
|
|
|
|
|
|
|||||||||
|
|
36.4 |
13.2 |
5.2 |
5.4 |
3.5 |
3.4 |
1.8 |
24.6 |
— |
93.4 |
|||||||||
|
|
2.5 |
119.5 |
152.4 |
144.8 |
159.2 |
146.6 |
148.0 |
939.5 |
729.9 |
2,542.4 |
La Colorada Skarn Project Incremental Economics
The existing
|
|
|
|
Operating Costs1 |
|
|
Mining cost ($/tonne mined) |
|
|
Processing cost ($/tonne processed) |
|
|
G&A cost ($/tonne processed) |
|
|
Cash cost per payable silver ounce (initial 5 yr. avg.)2 |
|
|
Cash cost per payable silver ounce (LOM) |
|
|
All-in sustaining cost per payable silver ounce (initial 5 yr. avg.) |
|
|
All-in sustaining cost per payable silver ounce (LOM) |
|
|
Capital Costs1 |
|
|
Initial capital in billions |
|
|
Sustaining capital3 in billions |
|
|
Total capital expenditures (LOM) in billions |
|
|
Economic Analysis (Base Case Prices)4 |
|
|
Annual after-tax incremental cash flow (initial 5 yr. avg.) in millions |
|
|
Cumulative after-tax incremental cash flow in billions |
|
|
Incremental NPV(5%) (After-tax) in billions |
|
|
IRR (After-tax) |
17% |
|
Pay-back period (After-tax, undiscounted) in years |
4 |
|
Notes: |
||
|
|
1. |
Cash costs and all-in sustaining costs are non-GAAP measures; please refer to the "Alternative Performance (non-GAAP) Measures" section of this news release for further information on these measures. |
|
|
2. |
Costs for the initial 5-year average include years 2034 to 2038, which follows the commissioning and ramp-up of the new processing facility. |
|
|
3. |
Sustaining capital includes capital leases. |
|
|
4. |
Assumes metal prices of |
The Revised PEA is preliminary in nature, includes inferred mineral resources that would be considered too speculative geologically to have the economic considerations applied to them that would enable them to be categorized as mineral reserves, and there is no certainty that the Revised PEA will be realized. Mineral resources that are not mineral reserves do not have demonstrated economic viability.
Initial Capital Estimate
|
Initial Capital Cost Estimate (in $ millions) |
|
|
Surface Infrastructure |
135 |
|
Processing Plant |
277 |
|
Paste Backfill Plant |
66 |
|
Initial Tailings Storage Facility ("TSF") Works |
42 |
|
Power |
34 |
|
Underground Access and Development1 |
622 |
|
Mining Equipment |
100 |
|
Dewatering |
19 |
|
Underground Infrastructure |
153 |
|
Subtotal Direct Costs |
1,448 |
|
Indirect Costs |
176 |
|
Subtotal Direct and Indirect Costs |
1,625 |
|
Contingency |
323 |
|
Total |
1,947 |
|
1. |
Contingency for "Underground Access and Development" is included in the |
Sensitivity Analysis
The following tables provide
|
Incremental NPV(5%) (After-tax) ($ billions) |
Ag prices ($/oz) |
||||
|
30.00 |
45.00 |
60.00 |
75.00 |
||
|
Zn prices ($/t) |
2,200 |
0.9 |
1.8 |
2.8 |
3.7 |
|
2,500 |
1.2 |
2.2 |
3.1 |
4.1 |
|
|
2,800 |
1.6 |
2.6 |
3.5 |
4.5 |
|
|
3,100 |
2.0 |
2.9 |
3.9 |
4.8 |
|
|
3,400 |
2.3 |
3.3 |
4.2 |
5.2 |
|
|
IRR (After-tax) (%) |
Ag prices ($/oz) |
||||
|
30.00 |
45.00 |
60.00 |
75.00 |
||
|
Zn prices ($/t) |
2,200 |
10 |
14 |
18 |
21 |
|
2,500 |
12 |
16 |
19 |
22 |
|
|
2,800 |
13 |
17 |
20 |
23 |
|
|
3,100 |
14 |
18 |
21 |
24 |
|
|
3,400 |
16 |
19 |
22 |
25 |
|
|
Notes: |
||
|
1. |
|
Assumes a lead metal price of |
Estimated Mineral Resources
Skarn Mineral Resource
The indicated mineral resource, reported effective as at
|
|
|
Grade |
Contained Metal |
||||
|
Classification |
Tonnes (millions) |
Zn (%) |
Pb (%) |
Ag (g/t) |
Zn (million tonnes) |
Pb (million tonnes) |
Ag (million ounces) |
|
Indicated |
265.4 |
2.85 |
1.37 |
36 |
7.6 |
3.6 |
309 |
|
Inferred |
61.7 |
2.55 |
0.95 |
30 |
1.6 |
0.6 |
59 |
|
Notes: |
||
|
1. |
|
The effective date of the mineral resource estimate is |
|
2. |
|
Mineral resources were estimated in accordance with the guidelines laid out in the CIM Mineral Resource and Mineral Reserves Estimation Best Practice Guidelines ( |
|
3. |
|
Mineral resources have been classified into indicated and inferred confidence categories in accordance with the CIM Definition Standards for Mineral Resources and Mineral Reserves ( |
|
4. |
|
Mineral resources have demonstrated reasonable prospects for eventual economic extraction as they show sufficient spatial continuity of mineralization constrained within a potentially mineable shape. Mineral resources that are not mineral reserves do not have demonstrated economic viability. No mineral reserves are reported at this time for the |
|
5. |
|
Prices used to report mineral resources are |
|
6. |
|
An estimated NSR (in US$/t) was calculated using metallurgical recoveries of 87.4% silver, 88% lead and 93% zinc with mineral concentrates containing 67% Pb in the lead concentrate and 60% Zn in the zinc concentrate, obtained from metallurgical testing. Estimates for transport, payability and refining/selling costs, based on experience and long-term views of the marketing, treatment and refining of these types of mineral concentrates, were included. |
|
7. |
|
Reasonable prospects for eventual economic extraction were assessed by determining the total insitu tonnes and metal grades constrained inside volumes that are based on a sub-level caving (SLC) mining methods. A cutoff of |
|
8. |
|
This mineral resource estimate was prepared under the supervision of, or was reviewed by |
La Colorada Vein Mine Mineral Reserves and Mineral Resources
|
|
|
Grade |
Contained Metal |
||||||
|
Classification |
Tonnes (millions) |
Ag (g/t) |
Au (g/t) |
Pb (%) |
Zn (%) |
Ag (million ounces) |
Au (thousand ounces) |
Pb (thousand tonnes) |
Zn (thousand tonnes) |
|
Proven Reserves |
3.4 |
300 |
0.21 |
1.24 |
2.17 |
33.2 |
23 |
42 |
75 |
|
Probable Reserves |
6.1 |
295 |
0.21 |
1.20 |
2.21 |
57.5 |
40 |
73 |
134 |
|
Proven & Probable Reserves |
9.5 |
297 |
0.21 |
1.21 |
2.19 |
90.7 |
64 |
115 |
208 |
|
Measured Resources |
0.4 |
229 |
0.12 |
0.91 |
1.55 |
3.0 |
2 |
4 |
6 |
|
Indicated Resources |
2.6 |
144 |
0.35 |
0.68 |
1.14 |
11.8 |
29 |
17 |
29 |
|
Measured & Indicated Resources |
3.0 |
156 |
0.32 |
0.71 |
1.20 |
14.8 |
30 |
21 |
36 |
|
Inferred Resources |
15.3 |
297 |
0.27 |
1.93 |
3.39 |
146.5 |
132 |
295 |
520 |
As of
The proven & probable mineral reserves have not been included in the Revised PEA economics.
Geology and Mineral Resources
The
The skarn deposit mineral resources are indicated in the blue shaded areas in the image below, and are mainly below the bottom of the
The resource model for the skarn deposit was updated in the Company's mineral resources and mineral reserves as at
Some mineral resources were not incorporated into the current strategic plan for the
Mining
Sub-level open stope mining ("SLOS") with paste backfill was selected as the preferred mining method for extracting mineral resources from the skarn deposit, prioritizing lower initial capital requirements, reduced geotechnical risk, and preservation of existing infrastructure, which allows for extended operation of the
The skarn deposit will be mined using a transverse, long hole stoping sequence to sustain an average mining rate of approximately 13,000 tpd over a 37-year operating period following completion and commissioning of the
Effective ventilation and heat management are key design considerations due to the region’s high geothermal gradient. The ventilation system is designed to deliver fresh chilled air through the production shaft and exhaust through two return air shafts, with a secondary circuit connected to the existing Guadalupe return air shaft and the initial 588 Level decline. A second return shaft will be completed during the production ramp-up period. The ventilation design assumes a diesel mining fleet but retains flexibility to incorporate battery electric vehicles in the future.
Approximately 155 million tonnes of skarn mineral resources are expected to be mined as part of the Revised PEA, with production ramping up to the nominal 13,000 tpd rate 2 years following completion of Project construction. The existing
In addition, the new infrastructure to access the skarn deposit is expected to provide improved access, ventilation and materials handling to the eastern portion of the vein mine and may create further opportunities to expand
Mineral Processing
Metallurgical testing completed for the
The selective flotation circuit is expected to produce high-quality marketable concentrates grading approximately 61% lead with 1,800 g/t silver in the lead concentrate and 59% zinc with approximately 140 g/t silver in the zinc concentrate. Overall silver recovery is estimated at approximately 89.7% with the majority, 77.8%, reporting to the lead concentrate and approximately 11.9% reporting to the zinc concentrate. LOM average recoveries are estimated to be approximately 93.4% for zinc and 87.7% for lead.
The proposed processing facility is designed to treat 5.5 Mt of mineralized material per year (15,000 tpd) using a conventional comminution and selective flotation flowsheet. Production material will be ground in a SAG–ball mill–pebble crusher (SABC) circuit followed by a staged selective flotation process to produce separate silver-bearing lead and zinc concentrates.
Chemical analysis of the concentrates indicates low levels of impurities and deleterious elements, consistent with products expected to be readily marketable.
Tailings Management
The remaining tailings from the
General Notes with Respect to Technical Information
The drill hole samples were prepared by the internal
Actlabs, SGS and ALS Global all used fire assay with gravimetric finish for gold, and acid digestion with ICP finish for silver, lead, zinc, and copper. Samples delivered to ALS Global were prepared in
The results of the QAQC samples submitted to SGS, Actlabs, Bureau Veritas, ALS Global and the
The Qualified Person for the mineral resource and mineral reserve estimate is of the opinion that the sample preparation, analytical, and security procedures followed for the samples are sufficient and reliable for the purpose of this news release and for the purpose of any future mineral resource and mineral reserve estimates. There were no limitations on the Qualified Persons' verification process. Pan American is not aware of any drilling, sampling, recovery or other factors that could materially affect the accuracy or reliability of the data reported herein.
See the Company’s Annual Information Form dated
Technical information contained in this news release has been reviewed and approved by
Cautionary Note to US Investors
This news release has been prepared in accordance with the requirements of NI 43-101 and the CIM, which differ from the requirements of
Canadian public disclosure standards, including NI 43-101, differ significantly from the requirements of the
About Pan American
Pan American is a leading producer of silver and gold in the
Learn more at panamericansilver.com
Follow us on LinkedIn
Alternative Performance (Non-GAAP) Measures
In this news release, we refer to measures that are non-GAAP financial measures. These measures are widely used in the mining industry as a benchmark for performance, but do not have a standardized meaning as prescribed by IFRS as an indicator of performance, and may differ from methods used by other companies with similar descriptions. These non-GAAP financial measures include:
- AISC. Any reference to “AISC” in this news release should be understood to mean all-in sustaining costs per silver ounce or zinc pound sold, net of by-product credits (respectively, the "Silver AISC"). Pan American believes that AISC, calculated net of by-products, is a more comprehensive measure of the cost of operating our consolidated business, given it includes the cost of replacing silver and zinc through exploration, the cost of ongoing capital investments at current operations ("sustaining capital"), as well as other items that affect the Company’s consolidated cash flow. AISC excludes capital investments that are expected to increase production levels or mine life beyond those contemplated in the base case life-of-mine plan ("project capital").
- Cash Costs. This metric facilitates comparison, on a mine-by-mine basis, notwithstanding the unique mix of incidental by-product production at each mine, of our operations’ relative performance on a period-by-period basis, and against the operations of our silver and gold mining peers. Cash costs per ounce is conceptually understood and widely reported in the mining industry.
- Free cash flow. This metric is calculated as net cash generated from operating activities less sustaining capital expenditures. Free cash flow does not have any standardized meaning prescribed by GAAP and is therefore unlikely to be comparable to similar measures presented by other companies. Pan American and certain investors use this information to evaluate the profitability of Pan American and identify capital that may be available for investment or return to shareholders.
Readers should refer to the "Alternative Performance (non-GAAP) Measures" section of Pan American’s MD&A for the year ended
Cautionary Note Regarding Forward-Looking Statements and Information
Certain of the statements and information in this news release constitute "forward-looking statements" within the meaning of the United States Private Securities Litigation Reform Act of 1995 and "forward-looking information" within the meaning of applicable Canadian provincial securities laws. All statements, other than statements of historical fact, are forward-looking statements or information. Forward-looking statements or information in this news release relate to, among other things: estimated average silver, zinc and lead production of the
These forward-looking statements and information reflect Pan American’s current views with respect to future events and are necessarily based upon a number of assumptions that, while considered reasonable by Pan American, are inherently subject to significant operational, business, economic and regulatory uncertainties and contingencies. These assumptions include: continued long-term demand for silver, zinc and other critical minerals; tonnage of ore to be mined and processed; ore grades and recoveries; prices for silver, gold and base metals remaining as estimated; currency exchange rates remaining as estimated; capital, decommissioning and reclamation estimates; development and production estimates; our mineral reserve and mineral resource estimates and the assumptions upon which they are based and the accuracy of such estimates and assumptions; prices for energy inputs, labour, materials, supplies and services (including transportation); no labour-related disruptions at any of our operations; no unplanned delays or interruptions in scheduled production; all necessary permits, licenses and regulatory approvals for our operations are received in a timely manner; our ability to secure and maintain title and ownership to properties and the surface rights necessary for our operations; and our ability to comply with environmental, health and safety laws. The foregoing list of assumptions is not exhaustive.
Pan American cautions the reader that forward-looking statements and information involve known and unknown risks, uncertainties and other factors that may cause actual results and developments to differ materially from those expressed or implied by such forward-looking statements or information contained in this news release and Pan American has made assumptions and estimates based on or related to many of these factors. Such factors include, without limitation: fluctuations in silver, gold and base metal prices; fluctuations in prices for, and availability of, energy inputs, including oil and gas, labour, materials, supplies and services (including transportation); changes in project parameters as plans continue to be refined; fluctuations in currency markets; operational risks and hazards inherent with the business of mining (including environmental accidents and hazards, industrial accidents, equipment breakdown, unusual or unexpected geological or structural formations, cave-ins, flooding and severe weather); actual costs and results of exploration activities; risks relating to the credit worthiness or financial condition of suppliers, refiners and other parties with whom Pan American does business; inadequate insurance, or inability to obtain insurance, to cover these risks and hazards; employee relations; relationships with, and claims by, local communities and indigenous populations; adverse political or economic developments in the countries in which we operate, as well as globally; our ability to obtain all necessary permits, licenses and regulatory approvals in a timely manner; changes in laws, regulations and government practices in the jurisdictions where we operate, including environmental, export and import laws and regulations; changes in national and local government, legislation, taxation, controls or regulations, including legal restrictions relating to mining and risks relating to expropriation; diminishing quantities or grades of mineral reserves as properties are mined; increased competition in the mining industry for equipment and qualified personnel; the duration and effects any pandemics or epidemics on our operations and workforce; those factors identified under the caption "Risks Related to Our Business" in Pan American's most recent form 40-F and Annual Information Form filed with the
View source version on businesswire.com: https://www.businesswire.com/news/home/20260324224365/en/
For more information contact:
VP, Investor Relations & Corporate Communications
Ph: 604-806-3191
Email: ir@panamericansilver.com
Source:
