This press release features multimedia. View the full release here: https://www.businesswire.com/news/home/20260428555303/en/
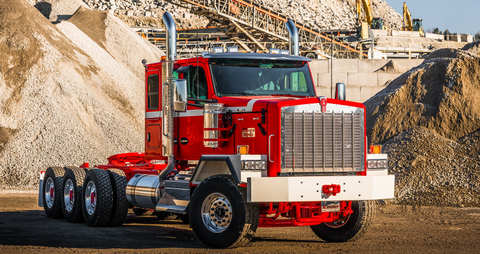
Kenworth C580 Vocational Truck
Highlights – First Quarter 2026
Highlights of PACCAR’s financial results during the first quarter of 2026 include:
-
Consolidated revenues of
$6.78 billion . -
Net income of
$605.3 million . -
PACCAR Parts revenue of
$1.71 billion . -
PACCAR Parts pretax income of
$402.3 million . -
PACCAR Financial Services pretax income of$115.5 million . -
Cash provided by operations of
$971.8 million . -
Capital investment of
$135.5 million and R&D expense of$109.1 million . -
Stockholders’ equity of
$19.76 billion .
Global Truck Markets
European truck industry registrations for the above 16-tonne market in 2026 are projected to be in a range of 280,000-320,000 trucks. “The aerodynamic and spacious DAF trucks offer industry-leading fuel efficiency and driver comfort to customers,” said
The South American above 16-tonne truck market is projected to be in the range of 100,000-110,000 trucks in 2026. “Kenworth and DAF trucks are renowned for their durability and advanced engineering, making them best-in-class for the challenging duty cycles of South America,” said
Kenworth Introduces C580 Heavy-Duty Vocational Truck
Kenworth unveiled the new Kenworth C580 truck at the
DAF Launches Battery-Electric Vocational Trucks
DAF XD, XF, XG and XG+ Electric trucks provide zero emissions ranges of up to 300 miles, depending on the application duty cycle and the number of battery packs. Customers benefit from DAF’s close collaboration with leading bodywork manufacturers throughout
PACCAR Parts Achieves Excellent Financial Performance
First quarter 2026 revenues were
PACCAR Parts’ 21 global PDCs, with over 4 million square feet, support more than 2,000 DAF, Kenworth and
PACCAR Financial Services Achieves Strong Quarterly Profits
PFS has a portfolio of 221,000 trucks and trailers, with total assets of
Capital and R&D Investments in Products, Technologies and Facilities
PACCAR’s consistent long-term profits, strong balance sheet, and focus on quality, technology, and innovation have enabled the company to invest
This release contains “forward-looking statements” within the meaning of the Private Securities Litigation Reform Act. These statements are based on management’s current expectations and are subject to uncertainty and changes in circumstances. Actual results may differ materially from those included in these statements due to a variety of factors. More information about these factors is contained in PACCAR’s filings with the Securities and Exchange Commission.
|
|
||||||||
|
SUMMARY STATEMENTS OF OPERATIONS (Unaudited) |
||||||||
|
(in millions except per share amounts) |
||||||||
|
|
|
|
|
|
|
|
||
|
|
|
|
Three Months Ended |
|
||||
|
|
|
|
|
|
||||
|
|
|
|
2026 |
|
|
2025 |
|
|
| Truck, Parts and Other: | ||||||||
| Net sales and revenues | $ |
6,234.3 |
|
$ |
6,913.7 |
|||
| Cost of sales and revenues |
5,416.5 |
|
5,891.0 |
|||||
| Research and development |
109.1 |
|
115.4 |
|||||
| Selling, general and administrative |
149.6 |
|
143.3 |
|||||
| Interest and other (income) expense, net |
(21.3 |
) |
325.8 |
(1) |
||||
| Truck, Parts and Other Income Before Income Taxes |
580.4 |
|
438.2 |
|||||
| Financial Services: | ||||||||
| Revenues |
542.2 |
|
528.0 |
|||||
| Interest and other |
342.9 |
|
350.3 |
|||||
| Selling, general and administrative |
39.7 |
|
38.3 |
|||||
| Provision for losses on receivables |
44.1 |
|
18.3 |
|||||
| Financial Services Income Before Income Taxes |
115.5 |
|
121.1 |
|||||
| Investment income |
80.4 |
|
83.8 |
|||||
| Total Income Before Income Taxes |
776.3 |
|
643.1 |
|||||
| Income taxes |
171.0 |
|
138.0 |
|||||
| Net Income | $ |
605.3 |
|
$ |
505.1 |
|||
| Net Income Per Share: | ||||||||
| Basic | $ |
1.15 |
|
$ |
.96 |
|||
| Diluted | $ |
1.15 |
|
$ |
.96 |
|||
| Weighted Average Shares Outstanding: | ||||||||
| Basic |
526.7 |
|
525.9 |
|||||
| Diluted |
527.4 |
|
526.9 |
|||||
| Dividends declared per share | $ |
.33 |
|
$ |
.33 |
|||
| (1) Includes a |
||||||||
|
|
||||||||
| CONDENSED BALANCE SHEETS (Unaudited) | ||||||||
| (in millions) | ||||||||
|
|
|
|||||||
|
2026 |
2025 |
|||||||
| ASSETS | ||||||||
| Truck, Parts and Other: | ||||||||
| Cash and marketable securities | $ |
8,595.4 |
$ |
9,253.7 |
||||
| Trade and other receivables, net |
2,256.9 |
1,981.1 |
||||||
| Inventories, net |
2,223.4 |
2,187.5 |
||||||
| Property, plant and equipment, net |
4,518.8 |
4,505.3 |
||||||
| Other assets |
3,610.8 |
3,605.2 |
||||||
| Financial Services Assets |
22,348.2 |
22,803.4 |
||||||
| $ |
43,553.5 |
$ |
44,336.2 |
|||||
| LIABILITIES AND STOCKHOLDERS' EQUITY | ||||||||
| Truck, Parts and Other: | ||||||||
| Accounts payable, deferred revenues and other | $ |
7,298.6 |
$ |
7,890.9 |
||||
| Financial Services Liabilities |
16,498.3 |
17,181.3 |
||||||
| STOCKHOLDERS' EQUITY |
19,756.6 |
19,264.0 |
||||||
| $ |
43,553.5 |
$ |
44,336.2 |
|||||
| Common Shares Outstanding |
526.2 |
525.4 |
||||||
|
|
|||||||
| CONDENSED CASH FLOW STATEMENTS (Unaudited) | |||||||
| (in millions) | |||||||
| Three Months Ended |
2026 |
2025 |
|||||
| OPERATING ACTIVITIES: | |||||||
| Net Income | $ |
605.3 |
|
$ |
505.1 |
|
|
| Depreciation and amortization: | |||||||
| Property, plant and equipment |
100.5 |
|
99.7 |
|
|||
| Other assets |
99.6 |
|
105.4 |
|
|||
| Net change in trade receivables, inventory and payables |
(74.4 |
) |
(42.0 |
) |
|||
| Net decrease in wholesale receivables on new trucks |
198.7 |
|
28.8 |
|
|||
| All other operating activities, net |
42.1 |
|
213.3 |
|
|||
| Net Cash Provided by Operating Activities |
971.8 |
|
910.3 |
|
|||
| INVESTING ACTIVITIES: | |||||||
| Payments for property, plant and equipment |
(147.2 |
) |
(165.1 |
) |
|||
| Acquisitions of equipment for operating leases |
(170.7 |
) |
(160.7 |
) |
|||
| Net decrease (increase) in financial services receivables |
163.8 |
|
(198.3 |
) |
|||
| Net increase in marketable debt securities |
(36.8 |
) |
(20.6 |
) |
|||
| Proceeds from asset disposals and other |
115.9 |
|
152.1 |
|
|||
|
|
(75.0 |
) |
(392.6 |
) |
|||
| FINANCING ACTIVITIES: | |||||||
| Payments of cash dividends |
(909.4 |
) |
(1,747.0 |
) |
|||
| Purchases of treasury stock |
(4.8 |
) |
(4.3 |
) |
|||
| Proceeds from stock compensation transactions |
42.4 |
|
22.5 |
|
|||
| Net decrease in debt and other |
(679.9 |
) |
(405.9 |
) |
|||
|
|
(1,551.7 |
) |
(2,134.7 |
) |
|||
| Effect of exchange rate changes on cash |
(8.2 |
) |
73.9 |
|
|||
|
|
(663.1 |
) |
(1,543.1 |
) |
|||
| Cash and cash equivalents at beginning of period |
6,307.9 |
|
7,060.8 |
|
|||
| Cash and cash equivalents at end of period | $ |
5,644.8 |
|
$ |
5,517.7 |
|
|
|
|
||||||||
| SEGMENT AND OTHER INFORMATION (Unaudited) | ||||||||
| (in millions) | ||||||||
|
Three Months Ended |
||||||||
|
|
||||||||
|
2026 |
|
|
2025 |
|||||
| Sales and Revenues: | ||||||||
| Truck | $ |
4,526.5 |
|
$ |
5,225.8 |
|
||
| Parts |
1,710.1 |
|
1,689.9 |
|
||||
| Financial Services |
542.2 |
|
528.0 |
|
||||
| Intersegment Eliminations and Other |
(2.3 |
) |
(2.0 |
) |
||||
| $ |
6,776.5 |
|
$ |
7,441.7 |
|
|||
| Pretax Profit: | ||||||||
| Truck | $ |
176.2 |
|
$ |
364.9 |
|
||
| Parts |
402.3 |
|
426.5 |
|
||||
| Financial Services |
115.5 |
|
121.1 |
|
||||
| Investment Income and Other |
82.3 |
|
(269.4 |
) |
(1) |
|||
| $ |
776.3 |
|
$ |
643.1 |
|
|||
| GEOGRAPHIC REVENUE | ||||||||
| (in millions) | ||||||||
|
Three Months Ended |
||||||||
|
|
||||||||
|
2026 |
|
|
2025 |
|||||
|
|
$ |
4,051.8 |
|
$ |
4,627.3 |
|
||
|
|
1,808.9 |
|
1,568.6 |
|
||||
| Other |
915.8 |
|
1,245.8 |
|
||||
| $ |
6,776.5 |
|
$ |
7,441.7 |
|
|||
| NEW TRUCK DELIVERIES | ||||||||
|
Three Months Ended |
||||||||
|
|
||||||||
|
2026 |
|
|
2025 |
|||||
|
|
17,800 |
|
22,200 |
|
||||
|
|
11,200 |
|
10,400 |
|
||||
| Other |
4,100 |
|
7,500 |
|
||||
|
33,100 |
|
40,100 |
|
|||||
| (1) Includes a |
||||||||
|
|
||||||
| SUPPLEMENTARY INFORMATION | ||||||
| RECONCILIATION OF GAAP TO NON-GAAP FINANCIAL MEASURES | ||||||
| (Unaudited) | ||||||
| “Adjusted net income (non-GAAP)” and “adjusted net income per diluted share (non-GAAP)” are financial measures that are not in accordance with |
||||||
| On |
||||||
| The Company utilizes these non-GAAP measures to allow investors and management to evaluate operating trends by excluding a significant charge that is not representative of company performance. | ||||||
| Reconciliations from the most directly comparable GAAP measures to adjusted net income (non-GAAP) and adjusted net income per diluted share (non-GAAP) are as follows: | ||||||
| Three Months Ended | ||
| ($ in millions, except per share amounts) |
|
|
| Net income | $ |
505.1 |
| EC-related claims, net of taxes |
264.5 |
|
| Adjusted net income (non-GAAP) | $ |
769.6 |
| Per diluted share: | ||
| Net income | $ |
.96 |
| EC-related claims, net of taxes |
.50 |
|
| Adjusted net income (non-GAAP) | $ |
1.46 |
View source version on businesswire.com: https://www.businesswire.com/news/home/20260428555303/en/
(425) 468-7530
ken.hastings@paccar.com
Source:
