Record Revenue, Cash Flow, and Adjusted Earnings with All Four Assets Advancing
This press release features multimedia. View the full release here: https://www.businesswire.com/news/home/20260506295804/en/
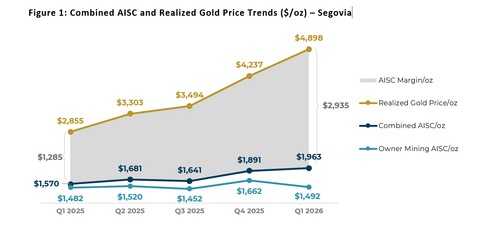
Figure 1: Combined AISC and Realized Gold Price Trends ($/oz) –
Q1 2026 Financial Performance
- Production of 74.3 thousand ounces (koz) of gold, up 6% from Q4 2025.
-
Gold revenue of
$364 million , up 21% from Q4 2025. -
Adjusted EBITDA1 of
$212 million , up 26% from Q4 2025. On a trailing 12-month basis, Adjusted EBITDA1 of$610 million . -
Adjusted net earnings of
$124 million or$0.60 /share, up from$0.46 /share in Q4 2025. -
Cash balance of
$472 million as ofMarch 31, 2026 , up$80 million fromDecember 31, 2025 . - Net debt reduced to near zero.
At Toroparu, the prefeasibility study is progressing well, with updated mineral resource and reserve estimates advancing to support mine schedule optimizations, and a construction decision is expected in early 2027. At Soto Norte, the submission of the environmental license application is nearing completion, alongside active engagement with the Colombian regulators to support a collaborative approach to the submission and review process.
With our producing assets delivering strong results and our growth projects continuing to advance,
|
|
Q1 2026 |
Q4 2025 |
Q1 2025 |
|
Gold production (koz), total |
74.3 |
69.9 |
54.8 |
|
Gold sold (koz), total |
74.8 |
71.7 |
54.3 |
|
|
|
|
|
|
|
40% |
46% |
41% |
|
EBITDA1 (US$M) |
|
|
|
|
Adjusted EBITDA1 (US$M) |
|
|
|
|
Adjusted EBITDA1, last 12 months (US$M) |
|
|
|
|
Net earnings4 (US$M) |
|
|
|
|
Adjusted earnings4 (US$M) |
|
|
|
|
Adjusted earnings4, last 12 months (US$M) |
|
|
|
Q1 2026 Operational Performance
-
Segovia produced 66.6 koz, a 5% increase over Q4 2025.- Production reflected the processing of 175.4 thousand tonnes (kt) at 12.41 g/t, compared to 201.1 kt at 10.10 g/t in Q4 2025.
-
AISC margin increased 31% to
$199 million from Q4 2025, supported in part by a 23% increase in average mill feed grade. -
Owner-operated mining contributed 64% of the mill feed, while Contract
Mining Partner (CMP) sourced mill feed contributed 36%, consistent with Q4 2025. -
Owner-operated mining AISC was
$1,492 /oz, compared to$1,662 /oz in Q4 2025, outperforming the full-year 2026 guidance range of$1,700 to$1,800 /oz, primarily reflecting a 14% increase in owner-mining attributable ounces sold, driven in part by higher average grades. - CMP-sourced gold delivered an AISC sales margin of 40%, achieving the top-end of the full-year 2026 guidance range of 35% to 40%.
-
Combined AISC was
$1,963 /oz, up 4% from$1,891 /oz in Q4 2025, reflecting the factors driving Owner-operated mining and CMP AISC described above.
-
Marmato produced 7.8 koz, a 16% increase over Q4 2025.
- Production reflected the processing of 77.0 kt at 3.53 g/t, compared to 74.6 kt at 3.12 g/t in Q4 2025.
-
This increased production reflects the operating capacity of the existing flotation plant together with mill feed sourced primarily from ore development and stopes in the
Bulk Mining Zone . -
Throughput is expected to increase materially upon commissioning of the new
Carbon -in-Pulp (CIP) plant later this year in the fourth quarter. Aris Mining plans to exit 2026 operating the 5,000 tpd design capacity CIP plant at approximately 3,000 tpd. Production is expected to increase through 2027, with throughput increasing to approximately 4,000 tpd by mid-2027 and reaching the full 5,000 tpd by the end of 2027 when the paste backfill plant is fully commissioned.
Project Development Highlights
-
Strong operating cash flow fully funded growth and generated
$42 million in net cash flow-
In Q1 2026, operations generated
$103 million in cash flow after sustaining capital and income taxes, fully funding the Company’s growth and expansion initiatives. After expansion capital,Aris Mining generated net cash flow of$42 million . Refer to the cash-flow summary in the following sections and MD&A for additional analysis.
-
In Q1 2026, operations generated
-
Marmato construction advancing on schedule
-
The new underground decline has now broken through into the cross-cut, marking an important milestone that provides direct access from the
Bulk Mining Zone to the new 5,000 tpd CIP plant. This connection establishes an additional access and ventilation pathway, facilitates ore and waste haulage between existing and new infrastructure, and supports the initial ramp-up of mine production. - The main civil, mechanical, and electrical works are advancing, with foundations for the mills, tailings thickener, and leach and CIP tanks completed.
- Construction of underground workshops, main pump station and field offices will begin in Q2 2026.
- First gold from the new CIP plant remains on schedule for Q4 2026.
-
The new underground decline has now broken through into the cross-cut, marking an important milestone that provides direct access from the
-
Toroparu Project (100% owned,Guyana )-
Aris Mining initiated a Prefeasibility Study (PFS) last year, targeted for completion in H2 2026, to support a construction decision in early 2027. - Work on updated mineral resource and reserve estimates is progressing well with mine scheduling and optimizations currently underway.
-
Alongside the PFS,
Aris Mining is also conducting geotechnical drilling, metallurgical test work, mining operation trade-off studies and detailed engineering to enable construction readiness by early 2027. -
Select pre-construction activities are continuing, including construction of the bridge at the
Puruni River crossing, key personnel ramp up, camp expansion and ongoing road works. -
Preliminary Economic Assessment (PEA) completed in
October 2025 , outlining an attractive project with average annual gold production of 235 koz and an after-tax NPV5% of$1.8 billion , IRR of 25%, and 3.0-year payback at an assumed gold price of$3,000 /oz.5
-
-
Soto Norte Project (100% owned,Colombia )- The studies required for submission of the environmental license application in support of the development of Soto Norte are nearing completion, supporting a targeted Q2 2026 submission.
-
Aris Mining continues active engagement with the Colombian regulators to support a collaborative approach to the environmental license submission and review process. -
PFS completed in
September 2025 , demonstrating robust economics with average annual gold production (years 2 to 10) of 263 koz and an after-tax NPV5% of$2.7 billion , IRR of 35%, and 2.3-year payback at an assumed gold price of$2,600 /oz.6 Strong leverage to higher gold prices, at$3,000 /oz the NPV5% increases to$3.3 billion with an IRR of 40%. - The PFS incorporates industry-leading environmental and social design features, including a metallurgical process free of cyanide and mercury and the integration of local community miners – 750 tpd (over 20% of Soto Norte’s 3,500 tpd processing capacity) has been dedicated to local contract mining partners.
Q1 2026 Conference Call Details
Management will host a conference call on
Participants may gain expedited access to the conference call by registering at Diamond Pass Registration. Once registered, call-in details will be displayed on screen which can be used to bypass the operator and avoid the call queue. Registration will remain open until the end of the live conference call.
Webcast
Conference Call
-
Toll-free North America : +1-833-821-0197 - International: +1-647-846-2328
Audio Recording
-
After the call, an audio recording will be available via telephone until end of day
May 14, 2026 -
Toll-free in the US and
Canada : +1-855-669-9658 - International: +1-412-317-0088; and using the access code: 7133252
A replay of the event will be archived at Events & Presentations -
About
The Company is advancing expansion projects at
Aris Mining’s portfolio supports a longer-term objective of approximately 1 million ounces of annual gold production2. Key projects include the high-grade Soto Norte gold project in
Additional information on
Endnotes
1. All references to adjusted earnings, EBITDA, adjusted EBITDA, growth capital investment, cash flow after sustaining capital and income taxes, cash costs ($ per oz) and AISC ($ per oz) are non-GAAP financial measures in this document. These measures are intended to provide additional information to investors. They do not have any standardized meanings under IFRS, and therefore may not be comparable to other issuers and should not be considered in isolation or as a substitute for measures of performance prepared in accordance with IFRS. Refer to the Non-GAAP Measures section in this document for a reconciliation of these measures to the most directly comparable financial measure disclosed in the Company’s financial statements.
2. Includes potential production estimates from Toroparu, which is based on a preliminary economic assessment effective
3.
4. Net earnings represents net earnings attributable to owners of the company, as presented in the annual and interim financial statements for the relevant period.
5. See technical report dated
6. See technical report dated
7. Reflects expected steady-state annual gold production run-rates of approximately 300 koz at
Non-GAAP Measures
Cash costs & all-in sustaining cost per ounce
|
|
For the three months ended, |
||
|
|
|
|
|
|
Total gold sold (ounces) |
67,709 |
64,456 |
47,390 |
|
Cost of sales1 |
116,108 |
103,043 |
67,091 |
|
Less: materials and supplies inventory provision1 |
— |
(1,174) |
— |
|
Less: royalties1 |
(11,139) |
(8,598) |
(4,519) |
|
Add: by-product revenue1 |
(7,449) |
(5,828) |
(3,073) |
|
Total cash costs |
97,520 |
87,443 |
59,499 |
|
Add: royalties1 |
11,139 |
8,598 |
4,519 |
|
Add: social contributions1 |
12,358 |
9,168 |
4,061 |
|
Add: sustaining capital expenditures and lease payments |
11,917 |
16,654 |
6,336 |
|
Total AISC |
132,934 |
121,863 |
74,415 |
|
AISC per ounce sold |
|
|
|
|
Marmato |
|
|
|
|
Total gold sold (ounces) |
7,134 |
7,261 |
6,891 |
|
Cost of sales1 |
23,096 |
21,322 |
15,384 |
|
Less: materials and supplies inventory provision1 |
— |
(254) |
— |
|
Less: royalties1 |
(3,332) |
(2,223) |
(1,840) |
|
Add: by-product revenue1 |
(306) |
(1,493) |
(313) |
|
Total cash costs |
19,458 |
17,352 |
13,231 |
|
Add: royalties1 |
3,332 |
2,223 |
1,840 |
|
Add: social contributions1 |
940 |
158 |
273 |
|
Add: sustaining capital expenditures |
1,481 |
2,192 |
733 |
|
Total AISC |
25,211 |
21,925 |
16,077 |
|
Consolidated |
|
|
|
|
Total gold sold (ounces) |
74,843 |
71,717 |
54,281 |
|
Cost of sales1 |
139,204 |
124,365 |
82,475 |
|
Less: materials and supplies inventory provision1 |
— |
(1,428) |
— |
|
Less: royalties1 |
(14,471) |
(10,821) |
(6,359) |
|
Add: by-product revenue1 |
(7,755) |
(7,321) |
(3,386) |
|
Total cash costs |
116,978 |
104,795 |
72,730 |
|
Add: royalties1 |
14,471 |
10,821 |
6,359 |
|
Add: social contributions1 |
13,298 |
9,326 |
4,334 |
|
Add: sustaining capital expenditures and lease payments |
13,398 |
18,846 |
7,069 |
|
Total AISC |
158,145 |
143,788 |
90,492 |
|
1. As presented in the financial statements and notes thereto for the respective periods |
|||
All-in sustaining cost per ounce – business units (
|
|
For the three months ended, |
||||
|
|
|
|
|
|
|
|
Total gold sold (ounces) |
45,789 |
40,260 |
40,984 |
32,685 |
26,963 |
|
Cost of sales1 |
54,858 |
52,773 |
48,502 |
39,532 |
34,799 |
|
Less: inventory provision |
— |
(895) |
— |
— |
— |
|
Less: royalties1 |
(7,805) |
(5,689) |
(5,000) |
(3,605) |
(2,783) |
|
Add: by-product revenue1 |
(5,037) |
(3,610) |
(2,566) |
(1,714) |
(1,748) |
|
Total cash costs |
42,015 |
42,578 |
40,936 |
34,213 |
30,268 |
|
Add: royalties1 |
7,805 |
5,689 |
5,000 |
3,605 |
2,783 |
|
Add: social contributions1 |
8,660 |
6,058 |
5,155 |
3,366 |
2,501 |
|
Add: sustaining capital and lease payments |
9,835 |
12,601 |
8,430 |
8,511 |
4,397 |
|
Total AISC |
68,315 |
66,926 |
59,521 |
49,695 |
39,949 |
|
AISC ($/oz sold) |
|
|
|
|
|
|
|
|
|
|
|
|
|
Total gold sold (ounces) |
21,920 |
24,196 |
24,596 |
21,066 |
20,427 |
|
Cost of sales1 |
61,250 |
50,271 |
44,747 |
37,187 |
32,292 |
|
Less: inventory provision |
— |
(279) |
— |
— |
— |
|
Less: royalties1 |
(3,334) |
(2,909) |
(2,532) |
(1,934) |
(1,736) |
|
Add: by-product revenue1 |
(2,412) |
(2,218) |
(1,550) |
(1,084) |
(1,325) |
|
Total cash costs |
55,505 |
44,865 |
40,665 |
34,169 |
29,231 |
|
Add: royalties1 |
3,334 |
2,909 |
2,532 |
1,934 |
1,736 |
|
Add: social contributions1 |
3,698 |
3,110 |
2,632 |
1,811 |
1,560 |
|
Add: sustaining capital and lease payments |
2,082 |
4,053 |
2,256 |
2,773 |
1,939 |
|
Total AISC |
64,619 |
54,937 |
48,085 |
40,687 |
34,466 |
|
AISC ($/oz sold) |
|
|
|
|
|
|
|
|
|
|
|
|
|
Total gold produced (ounces) |
66,567 |
63,137 |
65,549 |
51,527 |
47,549 |
|
Total gold sold (ounces) |
67,709 |
64,456 |
65,580 |
53,751 |
47,390 |
|
Gold revenue |
331,611 |
273,127 |
229,116 |
177,551 |
135,310 |
|
Avg realized gold price ($/oz sold) |
|
|
|
|
|
|
Cost of sales1 |
116,108 |
103,043 |
93,249 |
76,719 |
67,091 |
|
Less: inventory provision |
— |
(1,174) |
— |
— |
— |
|
Less: royalties1 |
(11,139) |
(8,598) |
(7,532) |
(5,539) |
(4,519) |
|
Add: by-product revenue1 |
(7,449) |
(5,828) |
(4,116) |
(2,798) |
(3,073) |
|
Combined cash costs |
97,520 |
87,443 |
81,601 |
68,382 |
59,499 |
|
Add: royalties1 |
11,139 |
8,598 |
7,532 |
5,539 |
4,519 |
|
Add: social contributions1 |
12,358 |
9,168 |
7,787 |
5,177 |
4,061 |
|
Add: sustaining capital and lease payments |
11,917 |
16,654 |
10,686 |
11,284 |
6,336 |
|
Combined AISC |
132,934 |
121,863 |
107,606 |
90,382 |
74,415 |
|
AISC ($/oz sold) |
|
|
|
|
|
|
AISC Margin |
198,677 |
151,264 |
121,510 |
87,169 |
60,895 |
|
1. As presented in the financial statements and notes thereto for the respective periods |
|||||
Operating free cash flow and free cash flow after growth and expansion capital
|
($’000) |
|
|
|
|
Operating cash flows before taxes1 |
184,981 |
160,462 |
51,882 |
|
Adjusting Items: |
|
|
|
|
Precious metal stream deposit settled (received) 1 |
(40,016) |
10,000 |
— |
|
Finance income1 |
(3,383) |
(4,353) |
(2,336) |
|
Impact of FX on cash and cash equivalents1 |
814 |
(545) |
768 |
|
Adjusted operating cash flows before taxes |
142,396 |
165,564 |
50,314 |
|
|
|
|
|
|
Less: Income taxes paid1 |
(26,171) |
(21,686) |
(5,121) |
|
Adjusted net cash provided by operating activities |
116,225 |
143,878 |
45,193 |
|
|
|
|
|
|
Less: Sustaining capital |
(12,837) |
(18,389) |
(6,589) |
|
Less: Sustaining lease payments |
(561) |
(457) |
(480) |
|
Cash flow from operations after sustaining capital and income taxes |
102,827 |
125,032 |
38,124 |
|
|
|
|
|
|
Less: Growth and expansion capital |
(61,251) |
(67,735) |
(43,010) |
|
Free cash flow after growth and expansion capital |
41,576 |
57,297 |
(4,886) |
|
1. As presented in the financial statements and notes thereto for the respective periods. |
|||
Additions to mineral interests, plant and equipment
|
($’000) |
|
|
|
|
Sustaining capital |
|
|
|
|
|
11,356 |
16,197 |
5,856 |
|
Marmato |
1,481 |
2,192 |
733 |
|
|
12,837 |
18,389 |
6,589 |
|
Non-sustaining capital |
|
|
|
|
Marmato |
47,031 |
43,562 |
29,661 |
|
|
5,454 |
16,161 |
6,368 |
|
|
3,445 |
4,885 |
4,570 |
|
|
5,321 |
3,127 |
2,411 |
|
Total ( |
61,251 |
67,735 |
43,010 |
|
Additions to mining interest, plant and equipment1 |
74,088 |
86,124 |
49,599 |
|
1. As presented in the financial statements and notes thereto for the respective periods. |
|||
Earnings before interest, taxes, depreciation, and amortization (EBITDA) and adjusted EBITDA
|
($000s) |
|
|
|
|
|
Earnings (loss) before tax1 |
161,672 |
97,519 |
76,094 |
12,258 |
|
Add back: |
|
|
|
|
|
Depreciation and depletion1 |
16,246 |
16,809 |
13,459 |
11,929 |
|
Finance income1 |
(3,383) |
(4,353) |
(2,437) |
(3,474) |
|
Interest and accretion1 |
7,408 |
10,431 |
9,390 |
10,833 |
|
EBITDA |
181,943 |
120,406 |
96,506 |
31,546 |
|
Add back: |
|
|
|
|
|
Share-based compensation1 |
7,602 |
20,663 |
9,497 |
8,136 |
|
(Income) loss from equity accounting in investee1 |
— |
(14) |
— |
— |
|
(Gain) loss on financial instruments1 |
1,762 |
3,058 |
6,385 |
50,737 |
|
Loss on disposal of mining interest and PPE1 |
— |
— |
3,200 |
— |
|
Loss on settlement of deferred revenue1 |
— |
4,990 |
— |
— |
|
Other (income) expense1 |
9,177 |
6,447 |
1,961 |
1,090 |
|
Foreign exchange (gain) loss1 |
11,590 |
12,446 |
13,520 |
7,224 |
|
Adjusted EBITDA |
212,074 |
167,996 |
131,069 |
98,733 |
|
1. As presented in the financial statements and notes thereto for the respective periods |
||||
|
($000s) |
|
|
|
|
|
|
Earnings (loss) before tax1 |
|
21,220 |
37,513 |
13,603 |
17,904 |
|
Add back: |
|
|
|
|
|
|
Depreciation and depletion1 |
|
10,734 |
9,530 |
9,019 |
8,082 |
|
Finance income1 |
|
(2,336) |
(1,606) |
(1,351) |
(1,691) |
|
Interest and accretion1 |
|
10,037 |
21,165 |
6,493 |
6,496 |
|
EBITDA |
|
39,655 |
66,602 |
27,764 |
30,791 |
|
Add back: |
|
|
|
|
|
|
Share-based compensation1 |
|
3,784 |
(483) |
2,533 |
1,373 |
|
(Income) loss from equity accounting in investee1 |
|
14 |
14 |
17 |
2,301 |
|
(Gain) loss on financial instruments1 |
|
16,628 |
(6,561) |
12,842 |
6,144 |
|
Other (income) expense1 |
|
535 |
1,116 |
(428) |
2,681 |
|
Foreign exchange (gain) loss1 |
|
5,997 |
(5,113) |
311 |
(7,211) |
|
Adjusted EBITDA |
|
66,613 |
55,575 |
43,039 |
36,079 |
|
1. As presented in the financial statements and notes thereto for the respective periods. |
|||||
Adjusted net earnings and adjusted net earnings per share
|
($000s except shares amount) |
|
|
|
|
|
Basic weighted average shares outstanding1 |
205,967,201 |
203,245,172 |
199,171,052 |
179,836,208 |
|
Net earnings (loss)1 |
97,614 |
50,863 |
42,011 |
(16,897) |
|
Add back: |
|
|
|
|
|
Share-based compensation1 |
7,602 |
20,663 |
9,497 |
8,136 |
|
(Income) loss from equity accounting in investee1 |
— |
(14) |
— |
— |
|
(Gain) loss on financial instruments1 |
1,762 |
3,058 |
6,385 |
50,737 |
|
Loss on disposal of mining interest and PPE1 |
— |
— |
3,200 |
— |
|
Loss on settlement of deferred revenue1 |
— |
4,990 |
— |
— |
|
Other (income) expense1 |
9,177 |
6,447 |
1,961 |
1,090 |
|
Foreign exchange (gain) loss1 |
11,590 |
12,446 |
13,520 |
7,224 |
|
Income tax effect on adjustments |
(4,057) |
(4,356) |
(4,732) |
(2,528) |
|
Adjusted net earnings |
123,689 |
94,097 |
71,842 |
47,762 |
|
Adjusted net earnings per share – basic ($/share) |
0.60 |
0.46 |
0.36 |
0.27 |
|
1. As presented in the financial statements and notes thereto for the respective periods. |
||||
|
($000s except shares amount) |
|
|
|
|
|
Basic weighted average shares outstanding1 |
171,622,649 |
170,900,890 |
169,873,924 |
151,474,859 |
|
Net earnings (loss) 1 |
2,368 |
21,687 |
(2,074) |
5,713 |
|
Add back: |
|
|
|
|
|
Share-based compensation1 |
3,784 |
(483) |
2,533 |
1,373 |
|
(Income) loss from equity accounting in investee1 |
14 |
14 |
17 |
2,301 |
|
(Gain) loss on financial instruments1 |
16,628 |
(6,561) |
12,842 |
6,144 |
|
Other (income) expense1 |
535 |
1,116 |
(428) |
2,681 |
|
Loss on extinguishment of Senior Notes1 |
— |
11,463 |
— |
— |
|
Foreign exchange (gain) loss1 |
5,997 |
(5,113) |
311 |
(7,211) |
|
Income tax effect on adjustments |
(2,099) |
2,536 |
(109) |
1,738 |
|
Adjusted net earnings |
27,227 |
24,659 |
13,092 |
12,739 |
|
Adjusted net earnings per share – basic ($/share) |
0.16 |
0.14 |
0.08 |
0.08 |
|
1. As presented in the financial statements and notes thereto for the respective periods. |
||||
Cash Cost and All-in Sustaining Cost
Cash costs per ounce, and all-in sustaining cost per ounce (as calculated in the tables above) are performance measures that reflect all the expenditures that are required to produce and sell an ounce of gold from operations. Management believes that these two measures are useful to market participants in assessing operating performance and the Company's ability to generate cash flow from current operations. These measures do not have standardized meanings under IFRS and may not be comparable to similar measures used by other issuers.
Operating Cash Flow and Free Cash Flow after
Cash flow from operations after sustaining capital and income taxes is calculated as adjusted net cash provided by operating activities, less sustaining capital and income taxes paid. Free cash flow after growth and expansion capital is calculated by further deducting growth and expansion capital. Management believes these measures are useful to market participants in assessing the Company’s ability to generate cash flow from operations after funding its capital requirements. These measures do not have standardized meanings under IFRS and may not be comparable to similar measures used by other issuers.
Growth and expansion capital represents additions to depletable and non-depletable mineral interests, right of use assets, exploration projects, and plant and equipment that are not sustaining in nature. Management believes this measure is useful to market participants in assessing the level of capital invested to expand operations, develop projects and support future growth separately from capital required to sustain current operations. This measure does not have a standardized meaning under IFRS and may not be comparable to similar measures used by other issuers.
EBITDA and Adjusted EBITDA
EBITDA is calculated as earnings before tax, adjusted to add back depreciation and depletion, finance income, and interest and accretion. Adjusted EBITDA is calculated by further excluding items that management does not consider to be reflective of the underlying operating performance. Management believes these measures are useful to market participants in assessing the Company’s operating performance and ability to generate cash flow from operations. These measures do not have standardized meanings under IFRS and may not be comparable to similar measures used by other issuers.
Adjusted Net Earnings and Adjusted Net Earnings Per Share
Adjusted net earnings is calculated as net earnings attributable to owners of the Company, adjusted for items that management does not consider to be reflective of the underlying operating performance of the Company Adjusted net earnings per share is calculated by dividing adjusted net earnings by the basic weighted average number of shares outstanding for the applicable period. Management believes these measures are useful to market participants in assessing the Company’s underlying financial performance and results on a per share basis. These measures do not have standardized meanings under IFRS and may not be comparable to similar measures used by other issuers.
Qualified Person and Technical Information
Forward-Looking Information
This news release contains "forward-looking information" or forward-looking statements" within the meaning of Canadian securities legislation. All statements included herein, other than statements of historical fact, including, without limitation, statements relating to the Company’s ability to deliver on its 2026 objectives, updates and timing for completion and first gold pour at the
Forward looking information and forward looking statements, while based on management's best estimates and assumptions, are subject to known and unknown risks, uncertainties and other factors that may cause the actual results, level of activity, performance or achievements of
Although
View source version on businesswire.com: https://www.businesswire.com/news/home/20260506295804/en/
Aris Mining Contact
Senior Vice President, Capital Markets
+1.917.847.0063
Director, Investor Relations
info@aris-mining.com
Source:
